
Think

Do you know how satellite antennas work?

A satellite dish is constructed and positioned in such a way that when it receives the signals, they are directed towards a particular point. These signals are then further transmitted to your television. The cross-section of these satellite dishes takes the shape of a parabola. You will find parabolic shapes in different natural and human made environments, including mountains, bridges, waterfalls, buildings, and the paths of projectiles through the air. The graphs for quadratic functions that model real life situations are often parabolic in shape.
Explore this!

Let us explore various real-life applications of quadratic functions.
The importance of thinking about a problem and trying to solve it yourself.
This course is designed to:
- Provide the fundamental background needed to understand important applications of functions in everyday life.
- Get you thinking about why certain mathematical processes are necessary.
- Get you interested in math. We will try to make this material interesting by encouraging you to apply it to your everyday life!
Can you think of ways you use math in your life?
Finances, measuring, building, determining when you will arrive somewhere, calculating tips, trajectories when playing sports, and many others.
Dan Meyer

Dr. Dan Meyer is an influential leader in math education. The following is Dan's bio, provided on “dy/dan,” his blog about news and innovations in math education:
Hi. I'm Dan Meyer. I taught high school math to students who didn’t like high school math. I have advocated for better math instruction here and on CNN, Good Morning America, Every Day With Rachel Ray, and TED.com. I earned my doctorate from Stanford University in math education and I’m currently the Chief Academic Officer at Desmos where I explore the future of math, technology, and learning. I have worked with teachers internationally and in all fifty United States. I was named one of Tech & Learning's 30 Leaders of the Future. I live in Oakland, CA.
Discover more

To find out more about Dan, use your preferred internet search engine and enter the terms “Dan Meyer math educator” and “personal blog.”
Take a moment to use this same search engine with the keywords ‘math class needs a makeover’ to find a video of Dr. Meyer where he discusses the importance of getting students to think about a problem and how to solve it before being given the steps to do so. You are encouraged to search for additional resources to help you think about the value of solving problems on your own.
Join the discussion

In his talk, Dr. Meyer explains why he works for Desmos. This is an online graphing platform that you may find useful throughout this course. He also outlines why this and other tools are beneficial for students hoping to work through problems on their own.
Use the course’s discussion forum to consider how assessing a problem before being given steps to solve it might help increase:
- your learning
- your retention
- your interest
Press the “Join The Discussion” button when you’re ready to engage.

Math Journal

You will be building a Math Journal throughout this course. It consists of 4 units: 1) Introduction to Quadratic Functions; 2) Analyzing Quadratic Functions; 3) Exponential Functions and Trigonometry and 4) Sinusoidal Functions. There are several learning activities within each unit.
At the end of each learning activity you will be prompted to create a journal entry, with suggestions about the content it should feature. These journal entries will serve as a summary of many of the important concepts in this course and will be useful when you are preparing for assessments. Therefore, show your learning in a way that will be the most meaningful to you.
Please feel free to add any pieces of information that you think are important in addition to the suggested content.
At the end of the course, you will submit 8 entries (two from each unit) from your math journal as your “Culminating Assessment - Math Journal.” (Opens in new window).

This icon indicates when you should be adding to your math journal.
Near the end of each unit you will have the opportunity to submit one journal entry for feedback. You may choose to make any suggested edits based on that feedback and include the entry in your culminating assessment. If you do that, you will have 4 of the required 8 journal entries completed before the end of the course!
Each of the 8 journal entries that you submit should include:
- the journal entry for that learning activity
- evidence of learning from that activity (picture(s) of worked examples, written explanations, a summary sheet, etc.)
Your math journal entries can be presented in a variety of ways.
Here are some suggestions:
- handwritten journal (scanned)
- online journal
- video recordings
- pictures
- audio recordings
Culminating Assessment: Math Journal Rubric
The following rubric provides an introduction to the criteria your teacher will use to assess your final 8 journal submissions. It will be important to keep this rubric in mind for each and every journal entry, but especially for those you plan to submit for assessment.
You may receive the following forms of feedback:
- Your teacher may highlight the phrases on the rubric that best describe your assignment to show you how you have done.
- Your teacher may also provide you with detailed comments about the strengths of your assignment, the areas of the assignment that need improvement, and the steps you should take before submitting another assignment like this one.
Pay careful attention to the following rubric. Your teacher will use it to assess your work. You should refer to it too, so you’ll know exactly what your finished assignment should look like.
Success Criteria:
- Knowledge of relevant and appropriate skills and procedures.
- Knowledge of relevant and appropriate facts and terms understanding of the meaning of the mathematical content.
| Level 4 | Level 3 | Level 2 | Level 1 |
|---|---|---|---|
| With a high degree of effectiveness | With considerable effectiveness | With some effectiveness | With limited effectiveness |
Success Criteria:
- Logical interpretation of problem evidence of modelling the problem, drawing conclusions, or justifying reasoning.
| Level 4 | Level 3 | Level 2 | Level 1 |
|---|---|---|---|
| With a high degree of effectiveness | With considerable effectiveness | With some effectiveness | With limited effectiveness |
Success Criteria:
- math vocabulary used accurately.
- math notation and symbols used appropriately.
- algebraic solutions, graphs, charts, diagrams organized and clearly written.
- mathematical thinking expressed clearly.
- reflection on mathematical thinking expressed clearly.
| Level 4 | Level 3 | Level 2 | Level 1 |
|---|---|---|---|
| With a high degree of effectiveness | With considerable effectiveness | With some effectiveness | With limited effectiveness |
Success Criteria:
- Relevant and appropriate selection of facts, skills, procedures.
- Relevant and appropriate connections made between math concepts.
- Relevant and appropriate connections made between math and the world outside the classroom.
| Level 4 | Level 3 | Level 2 | Level 1 |
|---|---|---|---|
| With a high degree of effectiveness | With considerable effectiveness | With some effectiveness | With limited effectiveness |

What is a relation?
A relation is a set of ordered pairs. It can be represented in various ways.
Examples of relations:

A) { (1,2), (5,3), (9,4), (7,1) }
. . . as a mapping diagram.
| x | y |
|---|---|
| 1 | 3 |
| 3 | 2 |
| 4 | 2 |
| 6 | 5 |
B) { (1,3), (4,2), (3,2), (6,5) }
. . . as a table of values
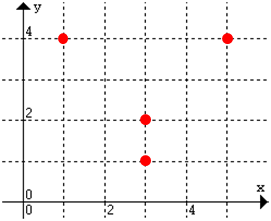
C) { (1,4), (3,2), (5,4), (3,1) }
. . . as a scatter plot
The domain is the set of first elements of the ordered pairs (the set of distinct x values).
The range is the set of second elements of the ordered pairs (the set of distinct y values).
Explore this!
Let's start by exploring the following video to find out the difference between a relation and a function.
Definition

A function is a relation where each element in the domain corresponds to exactly one element of the range. It can also be thought of as a rule that associates each x-value with only one y-value.
Note: More than one x-value can correspond to the same y-value.
A relation is not a function if one x value has 2 different y-values associated with it.
How to find whether a given relation is a function or not
Vertical line test
A vertical line test is used to check whether a graph represents a function or not. A graph represents a function if every vertical line intersects the graph in one point at most. This means that there is ONLY one element in the range for each element in the domain.
In other words, on a graph the idea of single valued means that no vertical line ever crosses more than one value. If it crosses more than once it is still a valid curve but it is not a function.
Explore this!
Let us explore how to conduct a vertical line test.
It is important to note that all functions are relations, but not all relations are functions. As we have discussed already, the easy way to determine whether or not a relation is a function is to use its graph and a vertical line test.
Note that the vertical line test states that a relation is a function if, for any value of x, you can draw a vertical line through at most one point on the graph of the relation.
Consider the following examples:
Parabola opening up
1)

Does this pass the vertical line test?
Yes / No
Therefore, is this relation a function?
Yes / No
Yes.
Parabola opening to the left
2)

Does this pass the vertical line test?
Yes / No
Therefore, is this relation a function?
Yes / No
No.
Straight line
3)

Does this pass the vertical line test?
Yes / No
Therefore, is this relation a function?
Yes / No
Yes.
Sine Function
4)

Does this pass the vertical line test?
Yes / No
Therefore, is this relation a function?
Yes / No
Yes.
Determining the type of relation (linear or quadratic) from graphs, tables, and equations
In this section we will try to learn about various methods by which we can determine whether the given relation is linear, quadratic or neither in nature.
There are 3 ways to determine if a relation is linear, quadratic, or neither:
- From a graph.
- From a table of values.
- From an equation.
Determining the type of relation from a graph
Some relations result in a line on a graph. These are called linear relations.
The following is an example of a linear function.
The equation of this graph is with slope, and intercept .
Some relations result in a parabola on a graph. Parabolas have a distinct shape as displayed in the following graphs. These relations are called quadratic relations.
Think
Can you think of two examples in your life where you can identify linear relations?
Speed, gas left in a car as you drive, etc.
Can you think of two examples in your life where you can identify quadratic relations?
Throwing a ball, hitting a golf ball, swings, diving, etc.
The vertex
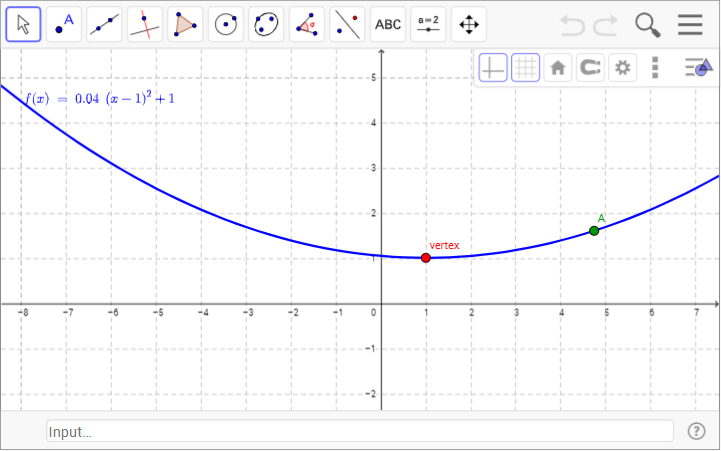
Parabolas have several distinct features to them, including the direction of the opening (either concave up or concave down) as well as a point known as the vertex. The vertex of a parabola will have distinct x-and y-coordinates (e.g. 0,0) and will also represent either the minimum or maximum y-value. Take time to explore how the vertex relates to the shape and direction of a parabola by selecting and dragging the vertex to different positions.
Join the discussion
How does the vertex relate to the shape of the parabola?
Press the “Join The Discussion” button when you’re ready to engage.
Determining the type of relation using table of values
Gurinder Singh owns GS's Garage. To fix a car, GS's Garage charges a base fee of $20, plus $40/h.
Let’s create a table of values to represent this relation. (The amount charged depends on the number of hours.)
| Hours | Charge |
|---|---|
| 0 | 20 + 40(0) = 20 |
| 1 | 20 + 40(1) = 60 |
| 2 | 20 + 40(2) = 100 |
| 3 | 20 + 40(3) = 140 |
| 4 | 20 + 40(4) = 180 |
Use 0, 1, 2, 3, 4 for the hours and then find these values for, hourly charge at GS's garage:
The following is a graph of these values for, hourly charge at GS's garage:
As you can identify, the table of values results in a linear relation.
First differences
To confirm this algebraically, we can find the first differences. The first differences indicate how much the relation is changing vertically for each horizontal change.
If the first differences are constant, it tells us the relation increases/decreases by a constant amount meaning it is linear.
We will now find the first differences by subtracting the y-values in the table to determine if they are constant. We subtract the values bottom to top. In order to use differences to identify the type of relation, the x-values must increase or decrease constantly.
| Hours | Charge |
|---|---|
| 0 | 20 |
| 1 | 60 |
| 2 | 100 |
| 3 | 140 |
| 4 | 180 |
| First differences |
|---|
| }
60 – 20 = 40 |
| }
100 – 60 = 40 |
| }
140 – 100 = 40 |
| }
180 – 140 = 40 |
Is the relation linear? Explain.
The relation is linear because the first differences are constant.
Second differences
The same concept can be applied when determining if a relation is quadratic. If a relation is quadratic, the second differences are constant. The second differences are found by subtracting the first differences. The first differences of linear relations increase or decrease by a constant amount. The same is true for the second differences of quadratic relations.
Comparing two sets of data using two tables of values
Calculate the first and second differences to determine if these two tables represents a linear, quadratic, or neither relation.
| 0 | 4 |
| 1 | 6 |
| 2 | 8 |
| 3 | 10 |
| 4 | 12 |
| First differences |
|---|
| }
(subtract bottom to top) 6 - 4 = 2) |
| }
8 - 6 = 2 |
| }
10 - 8 = 2 |
| }
12 - 10 = 2 |
| Second differences |
|---|
| }
2 - 2 = 0 |
| }
2 - 2 = 0 |
| }
2 - 2 = 0 |
Again, calculate the first and second differences.
| 0 | 4 |
| 1 | 10 |
| 2 | 12 |
| 3 | 10 |
| 4 | 4 |
| First differences |
|---|
| }
(subtract bottom to top) 10 - 4 = 6 |
| }
12 - 10 = 2 |
| }
10 - 12 = -2 |
| }
4 - 10 = -6 |
| Second differences |
|---|
| }
2 - 6 = -4 |
| }
- 2 - 2 = -4 |
| }
(-6) - (-2) = - 6 + 2 = -4 |
How to determine if a relation is linear or quadratic using a table of values
Now determine if the tables in the first and second difference equations represent linear or quadratic relations.
Notebook
Confirm the x values are increasing or decreasing by a constant amount
Are the x values in the tables increasing by a constant amount for both tables?
Yes.
Determine the first differences by subtracting the y values bottom to top
If the first differences are constant (the same), the table represents a linear relation.
Based on the first differences, is the first table linear? How do you know?
Yes. The first differences in the first table are constant.
Based on the first differences, is the second table linear? How do you know?
No. The first differences in the second table are not constant.
If the first differences are not constant, determine the second differences by subtracting the first differences. If the second differences are constant, the table represents a quadratic relation.
Based on the second differences, is the second table quadratic? How do you know?
Yes the second table is quadratic. The second differences are constant.
Determining the type of relation from an equation
Form of a linear equation
A linear function can be in the form:
It represents a linear relation because it is a degree 1 polynomial; the highest degree on the variable is 1.
Examples of linear equations
Form of a quadratic equation
A quadratic function can be in the form:
It represents a quadratic relation because it is a degree 2 polynomial; the highest degree on the variable is 2.
Examples of quadratic equations
We always search for the degree after we expand and simplify.
How to determine the type of relation from the degree of polynomial expression
The degree of a polynomial is the highest power of the variable in a polynomial expression. As you have learned, a polynomial is defined as an expression of more than two algebraic terms, especially the sum (or difference) of several terms that contain different powers of the same or different variable(s). It is a linear combination of monomials.
In order to determine the type of a relation from the degree of a polynomial expression, follow these steps:
- First do all necessary multiplication (expanding).
- Second, do all addition/subtraction (simplifying).
- Third, examine the result and determine the degree of the relation.
Expand the equation
When we expand we are multiplying terms.
You must apply the distributive property when expanding into brackets; multiplying all terms together.
Simplify the equation
When we simplify we are adding and/or subtracting terms.
We only simplify ‘like’ terms; terms with the same exponents on the same variables.
We add or subtract the coefficients of the like terms.
Practice determining the degree of a relation using a real-life example
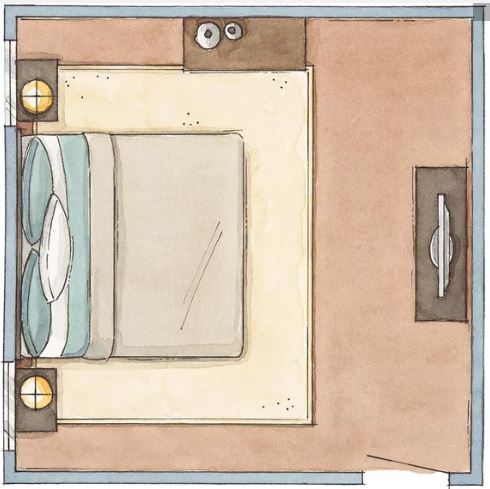
You are moving to a new place that has a square shaped bedroom 3 times the area of the one you have now (which is also square shaped). Determine a simplified expression for your new bedroom if the length of the sides of your current bedroom can be described by the relation .
Set up equation if not given
We are trying to find the equation of a bedroom three times the area of the one depicted.
(The formula for area of a square is ).
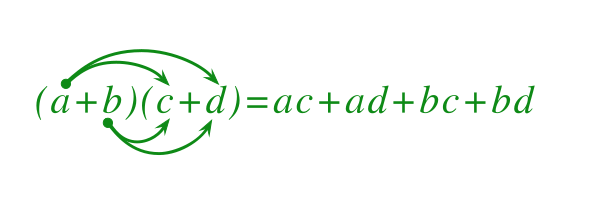
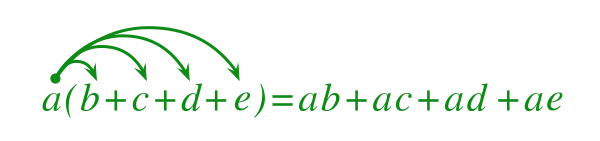
Expand the binomials by using the distributive property
Write the binomial out twice because it is squared.
The distributive property means to multiply every term in one bracket with everything in the other bracket.
Expand the monomial by using the distributive property
Multiply the number in front of the bracket with all terms inside the bracket.
Simplify like terms
Always add and subtract the coefficients of the like terms.
Therefore, a simplified expression for the area of the new bedroom is

Summary
- A function is a relation where each value of the independent variable corresponds with only one value of the dependent variable. The dependent variable is then said to be a function of the independent variable.
- Functions can be represented in words, by a table of values, by a set of ordered pairs in set notation, by a mapping diagram, by a graph, or by an equation.
- A function can also be defined as a relation in which each element of the domain corresponds to only one element of the range.
- The vertical-line test can be used to check whether the graph of a relation represents a function. If two or more points of the graph lie on the same vertical line, the relation is not a function.
- You can tell whether a function is linear or quadratic given:
- a table of values
- a graph
- an equation
Review your understanding of determining the type of relation
In the Minds On section, you have read that Dr. Dan Meyer works at Desmos. Use your preferred search engine to explore the Desmos site by creating a linear graph and creating a parabola. Screenshot your graphs to review for later.
Portfolio
Math journal
Create a table like the following in your math journal (Opens in new window). Complete it using GeoGebra(Opens in new window) or any other graphing tool you have access to.
| Linear relation graph example from GeoGebra | Quadratic relation graph example from GeoGebra |
|---|---|
Submit your portfolio item(s) by pressing the “Go To Portfolio” button.
 (Opens in new window)
Self-check
As a self-directed learner, you will be reflecting on your learning process and checking your understanding in order plan for success. Make a note of your understanding of the success criteria from today’s activity.
Rate your understanding on a scale of five to one.
Five means “I have a thorough understanding.” One means “I am confused.”
Are you able to
How will you work to improve your understanding where it is needed? One suggestion might be to search Mathify(Opens in new window) videos on the concepts to find out if that helps.
Portfolio
Math journal
Now take a moment to summarize, in your own words, how to determine if a relation is linear, quadratic, or neither from a graph, table, and an equation.
The following is a suggestion for how the table you make in your math journal could be organized.
| From a graph | From a table of values | From an equation | |
|---|---|---|---|
| Linear | |||
| Quadratic |
Summarize, in your own words, what it means to expand vs. simplify an expression.
Submit your portfolio item(s) by pressing the “Go To Portfolio” button.
(Opens in a new window)Further practice with quadratic relations
Consider the relation . Complete the following table for this relation. To check your understanding, compare your answers to the suggested ones.
| -4 | -16 |
| -3 | -9 |
| -2 | -4 |
| -1 | -1 |
| 0 | 0 |
| 1 | -1 |
| 2 | -4 |
| 3 | -9 |
| 4 | -16 |
| First differences |
|---|
| }
7 |
| }
5 |
| }
3 |
| }
1 |
| }
-1 |
| }
-3 |
| }
-5 |
| }
-7 |
| Second differences |
|---|
| }
-2 |
| }
-2 |
| }
-2 |
| }
-2 |
| }
-2 |
| }
-2 |
| }
-2 |
Notebook
Use your notebook to answer the following questions.
From the table data, how do you know this is a quadratic relation?
In the table, the second differences are constant, so the relation is quadratic.
From the equation, how do you know this is a quadratic relation?
The degree of the equation is 2, so the relation is quadratic.
Graph the relation.
What is the direction of opening of the parabola?
The parabola opens downward, so it is concave down.
State the vertex. Is it a minimum or a maximum point?
The vertex is (0,0) and is a maximum point.
What connection can you make between the second differences and the direction of opening of the parabola?
When the second differences are positive, the parabola is concave up.
When the second differences are negative, the parabola is concave down.
What connection can be made between the concavity of a parabola and whether it has a maximum (highest) or minimum (lowest) point?
A parabola that is concave down has a maximum point, and a parabola that is concave up has a minimum point.
Another practical example of quadratic relations in a real life scenario

Quadratic relations arise in many real-world situations, as shown in the following example about skid marks.
When investigating car accidents, the investigator measures the length of skid marks on the road. The investigator knows that the distance a car skids depends on the speed the car is travelling before the brakes are applied.
Suppose the driver of a car puts on the brakes and skids through a red light at an intersection. Explore the following video that demonstrates the relationship between the length of skid marks on the road and a car's speed. Then, proceed to the Notebook section to examine a table that the investigating officer uses to determine the car's speed in this situation.
Explore this!
Notebook
In your notebook, answer the following questions on your own. When you're finished, compare your answers to the suggested ones.
| Speed (km/h) | Skid length (m) |
|---|---|
| 0 | 0 |
| 10 | 0.7 |
| 20 | 2.8 |
| 30 | 6.3 |
| 40 | 11.2 |
| 50 | 17.5 |
| 60 | 25.2 |
| 70 | 34.3 |
| 80 | 44.8 |
| 90 | 56.7 |
| 100 | 70 |
Draw a curve of best fit for this data.
On a sheet of grid paper, draw a horizontal and vertical axis.
- The horizontal axis will represent Speed (km/h), and the vertical axis will represent Skid length (m).
- Select a suitable scale for the horizontal axis; for example, let one square represent 10 km/h. For the vertical axis, let one square represent 20 m. Hint: leave room on your graph so you can predict the speed of a car if it leaves an 80 m long skid mark.
- Graph the ordered pairs (0,0), (10,0.7), (20,2.8), (30,6.3), and so on from the table of values.
- Draw a smooth curve to connect the points.
- Title the graph Skid length vs. Speed.
Investigating officers observed that a skid mark was 80 m long. Use the curve to estimate the speed of the car.
- Extend the graph by following the same curve/trend in the data.
- Locate 80 m along the vertical axis.
- Draw a horizontal line across to the extended graph.
- Mark this point.
- Draw a vertical line down to the horizontal axis.
- Estimate the speed of the car.
Therefore, the car’s speed was approximately 107 km/h.
Determine the second differences to confirm whether or not this is a quadratic relation. Complete the following table to help you.
| Speed (km/h) | Skid Length (m) |
|---|---|
| 0 | 0 |
| 10 | 0.7 |
| 20 | 2.8 |
| 30 | 6.3 |
| 40 | 11.2 |
| 50 | 17.5 |
| 60 | 25.2 |
| 70 | 34.3 |
| 80 | 44.8 |
| 90 | 56.7 |
| 100 | 70 |
| First differences |
|---|
| }
0.7 |
| }
2.1 |
| }
3.5 |
| }
4.9 |
| }
6.3 |
| }
7.7 |
| }
9.1 |
| }
10.5 |
| }
11.9 |
| }
13.3 |
| Second differences |
|---|
| }
1.4 |
| }
1.4 |
| }
1.4 |
| }
1.4 |
| }
1.4 |
| }
1.4 |
| }
1.4 |
| }
1.4 |
| }
1.4 |
Notebook
Use your notebook to answer the following questions.
Based on what you found, is this a quadratic relation? Explain why or why not.
The second differences are constant, which confirms that the relation is quadratic.
Why do you not use negative length or speed values in this situation?
Negative values do not make sense for this situation because negative speed does not apply in real-world situations, nor does negative skid length. Speed and length are measured in positive values only.
Note: Extrapolating is the process of extending a graph to make predictions outside of the given data set.
Challenge

Answer these questions to see if you can categorize an equation as linear, quadratic, or neither.
Connecting to transferable skills

Recently, Ontario worked with other provinces in Canada to outline a set of competencies that are requirements to thrive. Ontario then developed its transferable skills framework as a set of skills for students to develop over time. These competencies are ones that are important to have in order to be successful in today’s world.
Read through the framework and the student look-fors (Opens in new window). Copy this document into your notes - you'll refer to it in each unit.
Note the indicators that you think you will develop in this course. At the end of the course you will revisit these skills to see which ones you actually developed and if your original predictions were correct.
As you continue through this unit and the rest of the course, keep your notebook updated and be mindful of opportunities to apply and develop transferable skills.