
In the previous unit, you learned about the definition of a function and how a function is different from a relation.
In this learning activity, you will learn about the properties of a function and how to present functions in various ways. We will also learn about function notation and the domain and the range of a function. Bringing this all together, we will discuss some real word situations that can be modelled by a table of values and by graphs.
Representing real-world applications of functions
Try it!

Graphs can be used to represent real-world applications of functions. In this learning activity, you will explore the relationship between real-world scenarios and how they can be rendered in graph form. Consider the following images, in each there is an object in motion. Try to imagine the path that the object in motion would take. From your imagined motion of the object, sketch a graph that represents that motion over time. Consider the values you would use for the x-axis and y-axis in your graphs.



Join the discussion

Share a sketch of your graph and the values you would use for the x-axis and y-axis with your classmates. Does your graph look similar to your classmates?
Press the “Join The Discussion” button when you’re ready to engage.

Now that you’ve considered how these different paths of motion would be represented graphically you will explore how different variables relate to each other and how these relationships can be represented and investigated mathematically.

Defining a function
Mathematical problems arise from real-world situations that involve relationships between quantities. The following are some examples:
- To determine the area of a circular patio, you need to know its radius.
- To find the revenue earned from selling tickets that cost $5 each, you need to know the number of tickets sold.
Mathematical relations are represented by equations that contain appropriate variables. For example:
- The equation for the area of a circle with radius is
- The equation for the revenue earned by selling tickets that cost $5 each is .
In each equation, one quantity depends on the other. Therefore, one quantity is called the dependent variable (which is plotted on the vertical axis of a graph) and the other quantity is the independent variable (which is plotted on the horizontal axis of a graph).
In the equation , the area depends on the radius, so is the dependent variable and is the independent variable. In the equation , the revenue depends on the number of tickets sold, so is the dependent variable and is the independent variable.
The following are tables of values for each of the relations discussed previously. The independent variable (first column in both tables) corresponds to the input value (on the horizontal axis). The dependent variable (second column in both tables) corresponds to the output value (on the vertical axis).
Table of values for
| 0 | 0 |
| 1 | 3.14 |
| 2 | 12.57 |
| 3 | 28.27 |
| 4 | 50.27 |
| 5 | 78.53 |
| 6 | 113.10 |
| 7 | 153.94 |
| 8 | 201.06 |
| 9 | 254.47 |
| 10 | 314.16 |
Table of values for
| 0 | 0 |
| 1 | 5 |
| 2 | 10 |
| 3 | 15 |
| 4 | 20 |
| 5 | 25 |
| 6 | 30 |
| 7 | 35 |
| 8 | 40 |
| 9 | 45 |
| 10 | 50 |
Notice that in both tables, each input value produces only one output value.
This type of relation is called a function; a relation where an input value produces only one output value. In a table, that means you would never see the same input value in two or more rows. Each input value only appears once.
The values in each of the preceding tables can be represented as ordered pairs. The first coordinate is the input (independent) value and the second coordinate is the output (dependent) value.
Notebook

In your notebook, work through the following questions. Check your work with the suggest answers provided.
Indicate the values from the table in the second function as coordinate points.
,,,,,,,,,,,,,,,,,,,,,
What do you notice about how many output ( values) there are for a given input value ( value).
Note that none of these ordered pairs have the same first value with different second values. This is true only for relations that are functions. This follows the idea that functions have one output ( value) for a given input ( value).
Is the relation with the following coordinate points a function? , , , , , , why or why not?
It is not a function because the ordered pairs and have the same first coordinate as do the ordered pairs , and also , . Therefore, the input values , , and each have two output values.
Considering the degree of both and , what specific type of relation/function do these represent?
The relation is a quadratic function because a variable is squared (which means the degree of the equation is two). The relation is a linear function because the degree of the equation is one.
Please note that all linear relations that can be represented by the form , where is the slope and is the intercept of the equation.
The following are a few examples of Linear Functions:
- , Here and
- , Here and
- , Here and
- , Here and
All quadratic relation that can be represented by the form, , where , and are constants with .
The following are a few examples of Quadratic Functions:
Determining if a relation is a function from an equation:
The equation of a relation does not represent a function if an input value can be found that produces more than one output value. As you have just learned, linear equations (except for vertical lines) and quadratic equations are functions. For equations you are unsure of, you must test -values that include zero and negative numbers.
Think

Which of the following relations represent functions? Can you justify your answer? Compare your solutions to the suggested answers provided.
Determining if a relation is a function from a graph (vertical line test)
You have learned how to determine if a relation is a function from a set of ordered pairs and from an equation. Now you will learn how to distinguish if a relation is a function from a graph.
The graph of each function and is created by plotting the input values along the horizontal axis and the output values along the vertical axis. Examine the graphs of these two functions in the following:
Interactive vertical line test
Now let's use the vertical line test in action!
The graph of a relation is a function if no two points on the graph can be connected by any vertical lines.
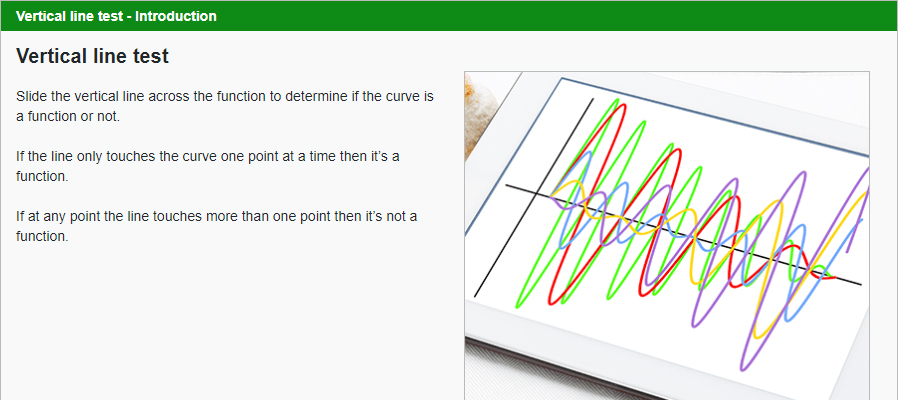
Slide the vertical line across the function to determine if the curve is a function or not.
- If the line only touches the graphed line or curve one point at a time then it’s a function.
- If at any point the line touches more than one point then it’s not a function.
In order to communicate clearly that you are representing a function, you must follow function notation. In this course, the function will usually start off with the “value of at ” or simply “.”
Function notation
You may have noticed that the relations and functions from earlier in this learning activity have been represented as:
- ordered pairs
- a table of values
- a graph
- an equation
The defining equation of any function can also be represented by function notation which you will next explore in more detail. The following table demonstrates how to express the defining equation of a linear function and a quadratic function using the function notation.
| Defining equation | Function notation |
|---|---|
The symbol is read as the “value of at ” or sometimes “ of .” This symbol simply means that the expression that follows the equal sign is a function and contains the variable “.”
Letters other than and can be used for function notation.
For instance, if the equation represents the height, , of a ball after time, , seconds, then it is appropriate to use the function notation . The variable inside the brackets represents the input value.
Complete the chart for each of the equations in the first column of the following table:
| Defining equation | Function notation |
|---|---|
| Notice that we use ‘’ to replace the ‘’ for function notation. | |
Using function notation like a machine
As you have learned, when using function notation, the variable inside the brackets represents the input values. For example, to determine for the function , we use the input value of , .
The preceding example shows that when the input value is , the output value is . This is represented by the point .
You can think of a function as a machine that performs operations on numbers. Input numbers go into the machine and have operations (adding, subtracting, multiplying, etc) performed on them. When all the operations are completed, they come out of the machine as output values.
The input/output machine
The following is the I/O machine in action!
You can examine that there is a direct connection between the input and output of a function.
In some cases, you do not know the equation of a function or it is not given. Function notation can also be used when a defining equation is not known or not given. Try the following exercise.
The following is the graph of .
Use the graph to determine , , , and . State the ordered pair for each.
Examine the graph of again.
Does the graph represent a function? Justify your answer.
Yes, the graph represents a function because it passes the vertical line test.

Some examples of functions in everyday life
In our surroundings, we come across many examples of functions.
Distance travelled by a continuously moving object is a function, as the moving object will be at a unique distance at a particular time. Moving objects cannot be at different distances at a given time.

You can find another example of a function in a grocery store because a unique price is associated to a particular brand of product. There cannot be two different prices of a given brand of product.
Self-check
Take a moment to reflect on what you have learned about investigating function notation in this learning activity.
As a self-directed learner, you will be reflecting on your learning process and checking your understanding in order plan for success. Make a note of your understanding of the success criteria from today’s activity.
Rate your understanding on a scale of five to one.
Five means “I have a thorough understanding.” One means “I am confused.”
Are you able to:
If you feel you need more practice visualizing when solve quadratic equations, you may want to have GeoGebra (Opens in new window) out to see the relation on a graph to aid in your algebraic solution.
Math journal
At the end of the course, you will fine-tune 8 entries (two from each unit) from your math journal and submit them as your “ Assessment - Math Journal” (Opens in new window).
In your math journal compare a relation and a function. Your summary may resemble the following table:
Comparing a relation and a function
| Similarities between a relation and a function | Differences between a relation and a function |
|---|---|
List the steps you would take to determine the function’s value (output) given an value (input) in your own words.
Portfolio

Submit your answers to your portfolio for feedback
- Given determine the following using your notebook.
- Determine
- State the ordered pair that corresponds to the input value of
- Determine
- State the ordered pair that corresponds to the input value of
- The function represents the height, in metres, of a toy rocket, seconds after it is launched into the air. Determine the height of the rocket after s.
Submit your portfolio item(s) by pressing the “Go To Portfolio” button.
 (Opens in a new window)
Connections
Once you feel ready, try the following questions that connect all topics from this activity. Here is an opportunity to test your understanding of function notation.
Complete a chart like this one for each equation in the first column. Check your answers when you are done.
| Equation | Function notation |
|---|---|
For each of the following functions, determine the output value for each given input value and then state the corresponding ordered pair.
The output value is .
The ordered pair is .