
In Learning Activity 1.1, we discussed the domain and range of a function. In this learning activity, we will study how to represent domain and range in set notation and how to find domain and range from a given graph and an equation.
Let us review the following definitions:
The domain of a function is the set of all values of the independent variable for which the function is defined.
The range of a function is the set of all values of the dependent variable that are determined from the values in the domain.
For real-world problems, the domain and range are often restricted to values that make sense to us.
Equation for the trajectory of a thrown horseshoe
In the last unit you were introduced to a problem involving a player throwing a horseshoe that was modelled by the equation , where is the height in meters and is the horizontal distance in meters.
What would this equation be in function notation?
You were shown the following graph of the situation.
The key points; -intercepts and vertex are labelled for your reference.
Notebook

In your notebook, answer the following questions about the graph we just reviewed. When you are finished, check your answers with the suggested answers provided.
a) Approximately, for what horizontal distance will the horseshoe reach a height of 3 m?
At m and m. Be sure to include to include both options when examining the graph.
b) Approximately, for what horizontal distance will the horseshoe reach a height of m?
The maximum height of the horseshoe is about m, it will never reach a height of m. This point does not exist on the graph.
c) Approximately, what height will the horseshoe be at when the horizontal distance is m?
Approximately m in height.
d) Approximately, what height will the horseshoe be at when the horizontal distance is m? Does this value make logical sense?
It will be at a height of about m.
This does not make sense because you cannot have a height of m.
Notice that not all values exist on the graph. For instance, you cannot find a -values above m.
Notice that not all values on the graph would be logical for this problem. For instance, you cannot have a height of m.

Set notation
In the ‘Minds on’ activity you learned that only some independent () and dependent () values exist in a relation.
The set of acceptable values in a relation is called the domain.
The set of acceptable values in a relation is called the range.
Domain
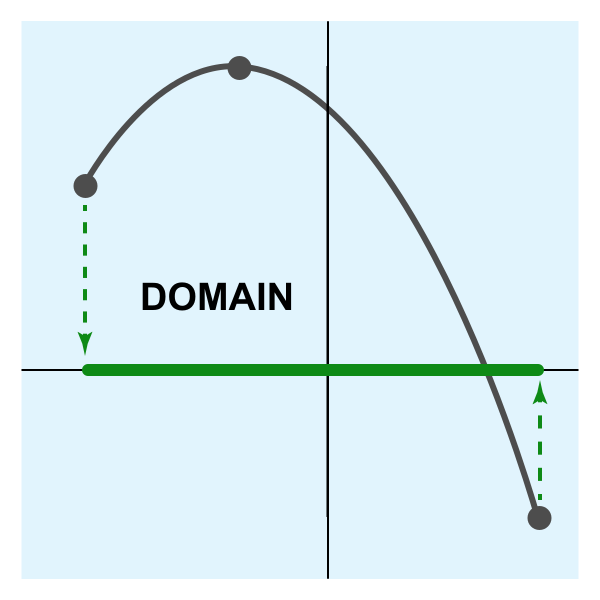
Domain is all the possible values of a function.
Range
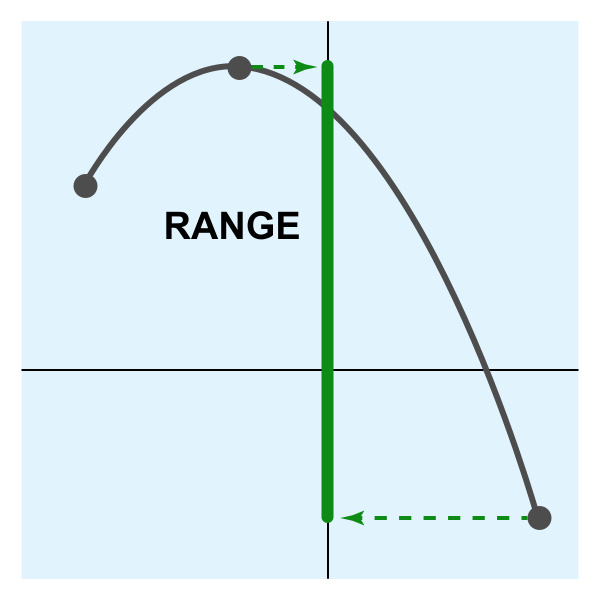
Range is all the possible values of a function.
Previously you learned that a real number is any number that can be represented as either a fraction or non-terminating, non-repeating decimal.
Domain:
If we examine the equation of area of a circle from the last activity, , logically, what does the radius, , have to be bigger than?
Has to be or bigger.
It would be impossible to have a negative value as the radius.
Since radius is the independent variable, we can state the domain (D) as follows:
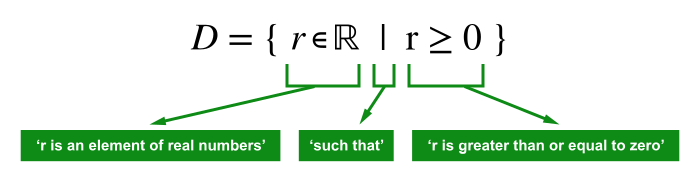
If this equation did not refer to area of a circle and just represented an equation , there would be no restrictions on and all values would be acceptable. We would write this domain as .
Range:
If we examine the equation of area of a circle from earlier, , logically, what restrictions would be on the area?
Has to be or bigger.
It would be impossible to have a negative value as the area.
Since area is the dependent variable, we can state the range () as:
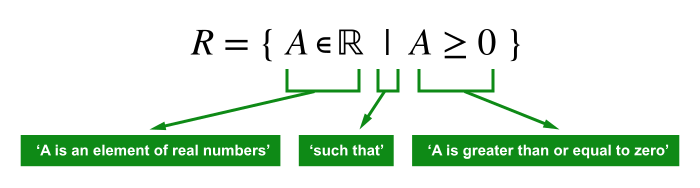
If the equation did not refer to area of a circle and just represented an equation , there would still be this restriction on the values because the values are all squares, resulting in only positive values. We would write this range as
Domain and range from a graph
Explore this!

Let’s explore more about the domain and range of quadratic functions discussed in the following video.
Try it

Let us now practice and determine the domain and range of the following graph.
What is the domain?
The smallest value that corresponds to the input values along the horizontal axis is . Therefore, the domain is the set of all real numbers such that is greater than or equal to . A shorter way to express the domain is in set notation, .
What is the range?
The smallest value that corresponds to the output values along the vertical axis is . Therefore, the range is the set of all real numbers such that is greater than or equal to . In set notation, .
Determine the domain and range of the following graph.
What is the domain?
All the input values along the horizontal axis, in both directions, will be used so the domain is the set of all real numbers, .
What is the range?
The smallest value that corresponds to the output values along the vertical axis is and the largest value is . So all the -values are in between, including and . In set notation, .
Domain and range from a linear equation
Examine the following graph of .
- Slope of
- -intercept of ()
Are there any restrictions on the or values?
No, the and value will continue forever in both directions.
State the domain and range for the line.
Domain and range from a quadratic equation
The graph of a quadratic function is a parabola. When looking at a parabola, are there any restrictions on the values?
No, the values will continue in both negative and positive direction for all parabolas.
State the domain of any quadratic function.
Note that this may change when the quadratic represents a ‘real life’ problem.
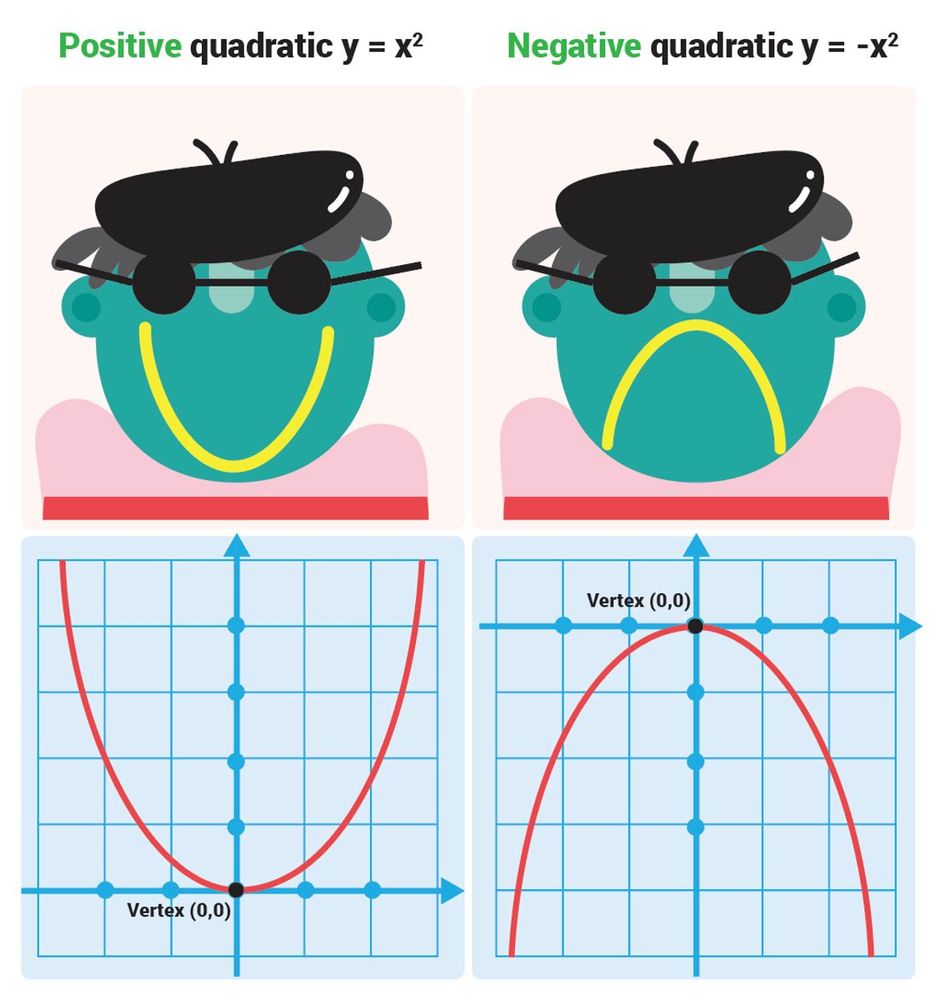
A parabola may open up (concave up) or may open down (concave down). When the leading coefficient on is positive, the quadratic is concave up. When the leading coefficient on is negative, the quadratic is concave down. The range of aquadratic function depends on the direction of opening of the parabola and the minimum or maxim mvalue of the function.
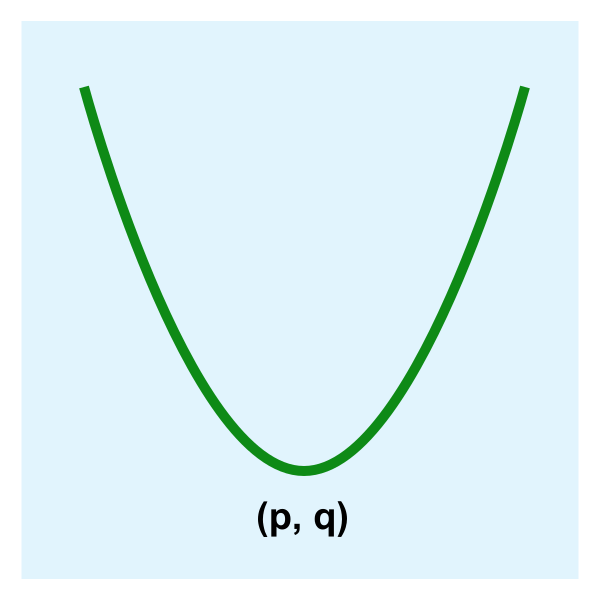
The vertex (p,q) is the minimum point when a parabola is concave up.
In this case, =q is the minimum value and so the range is .
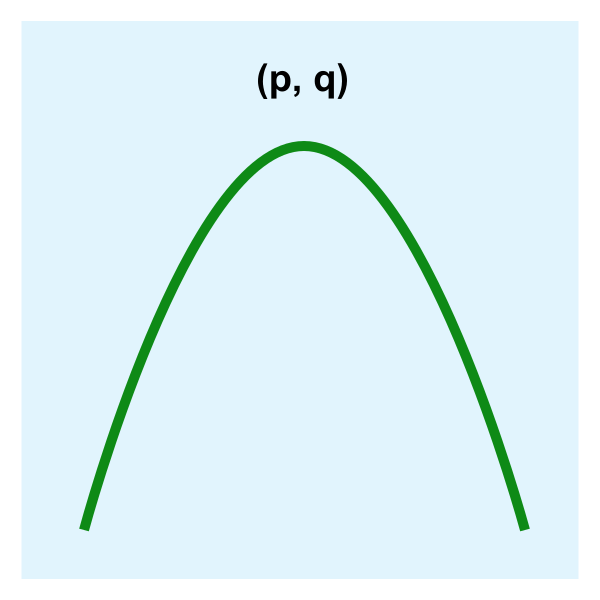
The vertex (p,q) is the maximum point for a parabola when it is concave down.
In this case, is the maximum value and so the range is .
Examples
1. Consider the domain and range of the following parabola:
What is the domain and range?
This parabola is concave up.
The vertex is the lowest point.
The value of the vertex is the minimum value of the parabola.
The domain is .
The range is .
2. Consider the domain and range of the following parabola:
What is the domain and range?
This parabola is concave down.
Good job. It’s time to consolidate your learning.

Summary
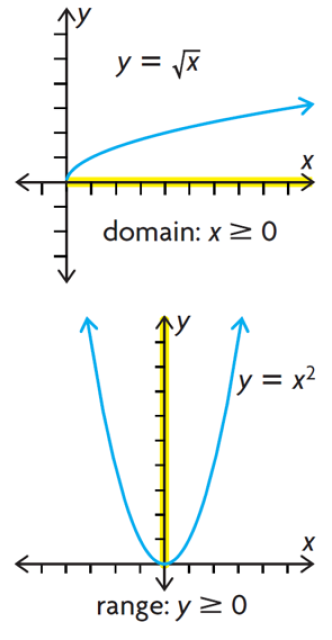
- The set of all values of the independent variable is called the domain. On a Cartesian graph, the domain is the set of all possible values of the independent variable . Example: The relation . exists only for positive values of . The domain of this relation is and all positive values of .
- The set of all values of the dependent variable is called the range. On a Cartesian graph, the range is the set of all possible values of the dependent variable . Example: The range is and all positive values of .
- A function can also be defined as a relation in which each element of the domain corresponds to only one element of the range.
- The vertical-line test can be used to check whether the graph of a relation represents a function. If two or more points lie on the same vertical line, then the relation is not a function.
- It is often necessary to define the domain and range using set notation. For example, the set of numbers ... , -2, -1, 0, 1, 2, ... is the set of integers and can be written in set notation as , where the symbol "|" means "such that" and the symbol "∈" means "belongs to" or "is a member of." So set notation for the integers would be read as "The set of all such that belongs to the integers."
Self-check
As a self-directed learner, you will be reflecting on your learning process and checking your understanding in order plan for success. Make a note of your understanding of the success criteria from today’s activity.
Make a note of your understanding of the success criteria from today’s activity.
Rate your understanding on a scale of five to one.
Five means “I have a thorough understanding.” One means “I am confused.”
Are you able to
If you feel you need more practice visualizing when solve quadratic equations, you may want to have Geogebra (Opens in new window) out to see the relation on a graph to aid in your algebraic solution.
Math Journal
At the end of the course, you will fine-tune 8 entries (two from each unit) from your math journal and submit them as your “Culminating Assessment - Math Journal” (Opens in new window)
Summarize how you can determine the range based on the concavity of the parabola. Your summary may look like this:
|
Parabola |
Vertex (p, q) |
Domain |
Range |
Suggested Answers |
|---|---|---|---|---|
|
Concave up |
Minimum point |
|||
|
Concave down |
Maximum point |
Press the start button if you wish to use the GeoGebra graphing tool. The GeoGebra tool will open in a new window, and can be used throughout this part of the learning activity.
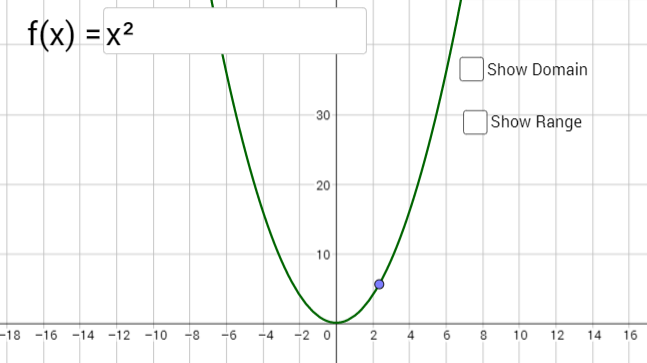 Start
(Opens in a new window)
Start
(Opens in a new window)
Again, in your math journal summarize the meanings of the domain and range of a graph, how to determine domain and range from a graph vs. from an equation and how domain and range can change when describing a real-life situation. Your summary may resemble the following table :
| What is it? | How to determine from a graph? | How to determine from an equation | How does it change for a real-life problem? | |
|---|---|---|---|---|
| Domain | ||||
| Range |
Once you feel comfortable with the success criteria, complete the following questions to assess your progress.
Further practice
Determine the domain and range of the following graph of a function.
Determine the domain and range of the following graph of a function.
Making connections
Examine the function, . This function represented the height of a rocket, in metres, after seconds.
The graph of this function is displayed beside:
Answer the following questions based on the graph in your notebook, and when complete compare your answers with the suggested answers provided.