
Inuit culture and parabolas
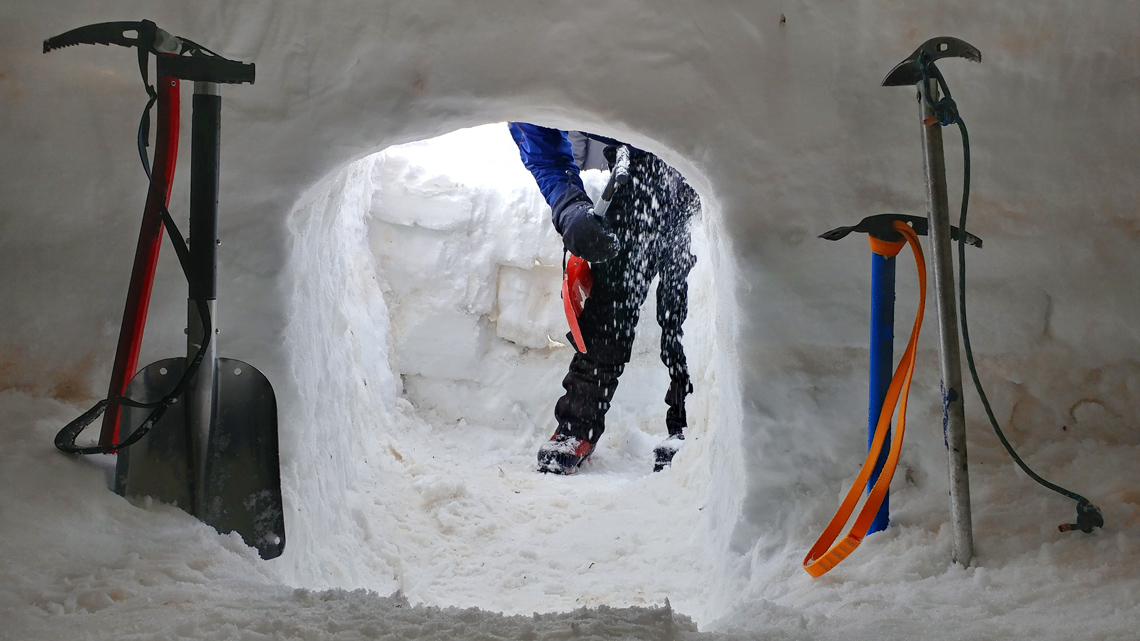
Igloos are traditional Inuit homes made up of snow blocks. They are in the shape of an archeddome and are designed with the knowledge that hot air rises and cold air sinks. Inside the dome hot air is produced from human bodies and the qulliq (seal oil lamp) eventually becoming trapped in the Igloo. Cold air sinks and collects at the entrance since it is the lowest point of the dwelling. The ventilation holes around the dome release the carbon dioxide produced inside.
Meaning of transformations
Transformations are operations performed on functions to change the position or shape of the associate curves or lines. In other words, the meaning of transformation is "to change from one place, state, form, or appearance to another". When we take a function and tweak its value so that its graph is moved to another spot on the axis system, yet remains recognizably the same graph, we are said to be "transforming" the function.
Explore this!

Let us examine the detailed steps involved in this method in the following video.
The following are some of the most important ideas from the video.
Key deas
- Quadratic functions can be written in the form .
- Each of the constants a, h, and k changes the position and/or shape of the graph of .
Need to know
- Changing the values of h and k changes the position of the parabola and, as a result, the locations of the vertex and the axis of symmetry. The new parabola is congruent to the parabola.
- Changing the value of a can change the shape of the parabola, as well as the direction in which the parabola opens. The new parabola is not congruent to the parabola when a ≠ 1 or −1.
Graphing tool
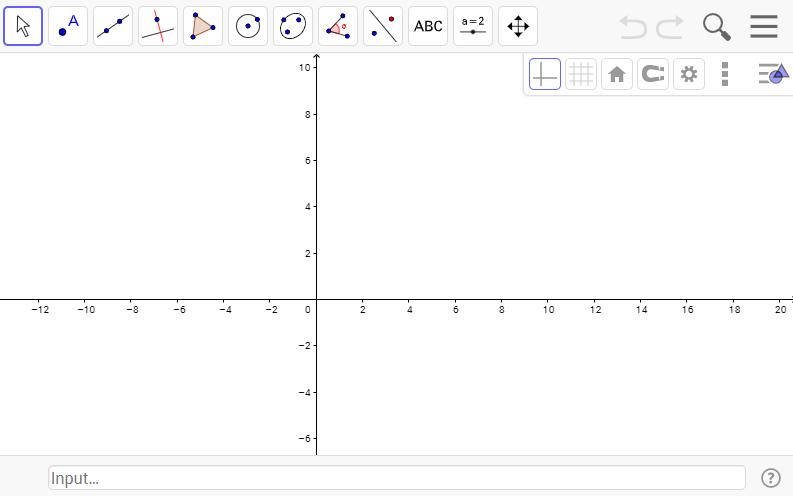
Throughout the remainder of this course, you’ll use the following graphing app, GeoGebra, provided for several investigations involving quadratic functions. Explore the following instructions to learn how to use the app properly. As practice, graph the function:
Graphing quadratic functions
You can use this applet to graph and compare quadratic functions for Investigations and Support Questions.
To enter equations
- for exponents, use the ^ caret;
- for multiplication, use the * asterisk;
- for division, use the / slash;
- ensure you use brackets correctly;
- press the [Enter] key.
For example, to graph y = 3(x – 4)2 + 7, enter y=3*(x-4)^2+7.
GeoGebra tricks
You can enter two functions, then add or subtract or multiply or divide them. Try the following equations:
- f(x)=x^2+10
- g(x)=x+5
- h(x)=f(x)-g(x)
Created with GeoGebra (Opens in new window)
Press the start button if you wish to use the GeoGebra graphing tool. The GeoGebra tool will open in a new window, and can be used throughout this part of the learning activity.
 (Opens in a new window) Start (Opens in a new window)
We will use function notation when naming the graphs to make it easier to identify specific graphs in the investigations.
You can use any of the quadratic functions from earlier in the course (or make up your own) for further practice using the graphing app.

Investigation 1:
In this activity we will examine transformations. A transformation is a modification on the output values of a function because of a change to the parameters in the equation. In the equation , x and y are variables and a,h and k are parameters.

Complete the following tables of values for the two functions and .
When you’re finished, compare your answers to the suggested ones.
| -2 | 4 |
| -1 | 1 |
| 0 | 0 |
| 1 | 1 |
| 2 | 4 |
| -2 | 8 |
| -1 | 2 |
| 0 | 0 |
| 1 | 2 |
| 2 | 8 |
Notebook

When you have completed using the graphing app, use your notebook to complete the following questions. Check your answers with the suggested answers provided.
How do you think the -values between the two functions are related?
The -values for the second equation are double those of the first equation.
Predict what the -values of might be in comparison to those of .
The -values would be tripled.
To check if your prediction was correct, create a table of values for using the same -values as earlier.
Now use the following graphing app to graph . Then press enter and graph together on the same screen.
Press the start button if you wish to use the GeoGebra graphing tool. The GeoGebra tool will open in a new window, and can be used throughout this part of the learning activity.
(Opens in a new window)Start (Opens in a new window)Notebook
When you have completed using the graphing app, use your notebook to complete the following questions. Check your answers with the suggested answers provided.
Describe the similarities between the graphs of and
They both open the same direction. They both have the same vertex and it is on the origin .
Describe the differences.
The graph of is skinnier than the other graph.
How does changing the -value to affect the graph of of ?
It stretches it vertically and becomes skinnier.
Predict what the graph of might be like in comparison to these graphs.
It will stretch even more.
To check if your prediction was correct, add the graph of to your graph using the graphing app.
Provide a conclusion about how the a-value, for in transforms the graph of .
When , it vertically stretches the graph by that a value.
Investigation 2:
Complete the tables of values for following two functions. When you’re finished, compare your answers with those provided.
| 4 |
How are the -values related?
The values of the second function are half of the values of the first function.
Use the following graphing tool to graph and together.
Press the start button if you wish to use the GeoGebra graphing tool. The GeoGebra tool will open in a new window, and can be used throughout this part of the learning activity.
(Opens in a new window)Start (Opens in a new window)Notebook
When you have completed using the graphing app, use your notebook to complete the following questions. Check your answers with the suggested answers provided.
Describe the similarities.
They both open the same direction. They both have the same vertex and it is on the origin .
Describe the differences.
The first graph is skinner than the second graph.
How does changing the -value to affect the graph of .
The value of , compresses the parabola vertically.
Predict what the graph of might be like in comparison to these graphs.
It would be compressed even more.
To check if your prediction was correct, add the graph of to your graph using the graphing app.
Provide a conclusion about how the a value, for in transforms the graph of .
When , it vertically compresses the graph by .
Investigation 3:
Use the following graphing application to graph and on the same grid.
Press the start button if you wish to use the GeoGebra graphing tool. The GeoGebra tool will open in a new window, and can be used throughout this part of the learning activity.
(Opens in a new window)Start (Opens in a new window)Notebook
When you have completed using the graphing app, use your notebook to complete the following questions. Check your answers with the suggested answers provided.
Describe the similarities between the graphs of and .
Same vertex , both graphs are the same width.
Describe the differences.
The graph of opens down.
How does changing the -value to affect the graph of ?
It flips (reflects) the graph over the -axis.
Predict what the graph of and might be like in comparison to these graphs.
The negative ‘’ value tells us it’s reflected about the -axis. Since , the graph would be stretched vertically by for the first graph and for the second graph.
To check if your prediction was correct, add the graphs of and to your graph using the graphing app.
Provide a conclusion about how the value , where in transforms the graph of .
When a is less than , the graph is reflected (flipped) about the -axis and then vertically stretched by the positive value of the number.
For example: , would be reflected about the -axis and vertically stretched by .
Investigation 4:
Add and to your graph from Investigation . (Investigation 1 graphs )
Press the start button if you wish to use the GeoGebra graphing tool. The GeoGebra tool will open in a new window, and can be used throughout this part of the learning activity.
(Opens in a new window)Start (Opens in a new window)Notebook
When you have completed using the graphing app, use your notebook to complete the following question. Check your answers with the suggested answers provided.
Provide a conclusion about how the value , where in transforms the graph of .
When a is greater than and less than , the graph is reflected (flipped) about the -axis and then vertically compressed by the positive value of the number.
For example: , would be reflected about the -axis and vertically compressed by .
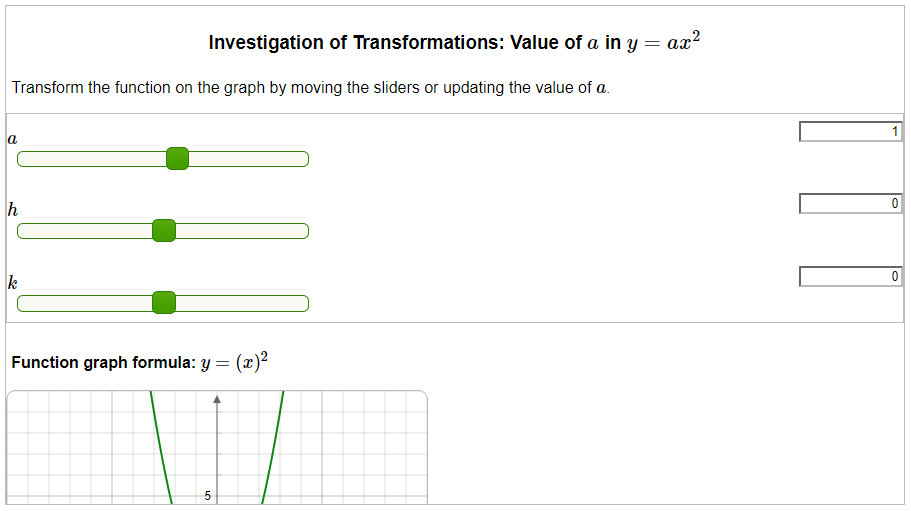
To solidify what you've learned in the investigations, explore the following graph application more with sliders show how different values affect the graph of
Write a short paragraph explaining what you explored and how the a values affect the graph. What happens to the graph when the value increases? Decreases? Submit your answer to your portfolio for feedback.
 (Opens in a new window)Start (Opens in a new window)
Sketching parabolas of
An axis of symmetry is an imaginary line that cuts a parabola in half and passes through the vertex. Let’s compare the properties of the graph of to the graph of . Sketch the graphs with technology or in your notebook. Compare your answers with those provided.
Did you notice that the graph of is obtained by reflecting the graph of in the -axis?
Notice that both functions have the same vertex, domain, and axis of symmetry.
Symmetrical points
The axis of symmetry cuts a parabola in half. Any two points that are directly across from each other on the parabola can be joined by a horizontal line that is perpendicular to the axis of symmetry. These points will have the same -values and are equidistant from the axis of symmetry.
Let’s examine the following graph of .
For the graph, the points A and B are symmetrical points. They have the same -coordinate. These two points are the same distance (equidistant) from the axis of symmetry.
The same is true for the points C and D, and any other points that are on opposite sides of the axis of symmetry.
Practice on role of in
Describe the transformations that are applied to the graph of to obtain the graph of .
The value of the coefficient is between and . The parabola is vertically compressed by and reflected in the -axis.
Describe the following characteristics for the graph . When you’re finished, compare your answers with the suggested ones.
Notebook
Using your notebook and the information you discovered above— sketch a graph of the function. When you’re finished, compare your sketch with the suggested answer.
Represent the equations of two different quadratic functions that represent the transformations for each of the following cases:
Investigation 5:
Graph and together. When you’re finished graphing these two functions, continue on to answer some practice questions.
Press the start button if you wish to use the GeoGebra graphing tool. The GeoGebra tool will open in a new window, and can be used throughout this part of the learning activity.
(Opens in a new window)Start (Opens in a new window)Notebook
When you have completed using the graphing app, use your notebook to complete the following questions. Check your answers with the suggested answers provided.
Compare the two graphs. Describe their similarities.
They both open up. They both are the same width. The vertex has the same -value.
Describe their differences.
One is moved along the -axis.
Consider the role of in . How does the value in change the graph of ?
It moves the graph one unit to the right.
Graph the following functions using the following applet:
Submit a copy of your graphs to your portfolio for feedback.
Press the start button if you wish to use the GeoGebra graphing tool. The GeoGebra tool will open in a new window, and can be used throughout this part of the learning activity.
(Opens in a new window)Start (Opens in a new window)Notebook
When you have completed using the graphing app, use your notebook to complete the following questions. Check your answers with the suggested answers provided.
Compare all the graphs. Describe their similarities.
All are concave up. They all have the same -value for their vertex. They are all the same width.
Describe their differences.
Each one keeps moving to the right by one unit.
In general, how does the value of in transform the graph of ?
For in the graph will be translated units to the right.
Investigation 6:
You will use the graphing app to answer the following questions. Suppose the value of is negative, . Substituting in results in , which simplifies to .
Think!

Predict what the graph of might be like in comparison to the graph .
It may move to the left since we learned that when , it moves to the right.
Press the start button if you wish to use the GeoGebra graphing tool. The GeoGebra tool will open in a new window, and can be used throughout this part of the learning activity.
(Opens in a new window)Start (Opens in a new window)Notebook
When you have completed using the graphing app, use your notebook to complete the following questions. Check your answers with the suggested answers provided.
Was your prediction correct?
Yes the graph was moved one unit to the left.
Add the following functions to your graph:
Compare all the graphs. Describe their similarities.
All are concave up. They all have the same -value for their vertex. They are all the same width.
Describe their differences.
The graphs continue to be translated one unit to the left.
How does the value in transform the graph of ?
For in the graph will be translated units to the left.
Practice the role of in
Each of the following graphs represents a horizontal translation of the graph of . Complete an analysis of the following graph to determine the graph’s equation.
This graph represents a horizontal translation of the graph of . Complete an analysis of the graph to determine the graph’s equation.
Investigation 7:
Use the graphing app to graph and .
Press the start button if you wish to use the GeoGebra graphing tool. The GeoGebra tool will open in a new window, and can be used throughout this part of the learning activity.
(Opens in a new window)Start (Opens in a new window)Notebook
When you have completed using the graphing app, use your notebook to complete the following questions. Check your answers with the suggested answers provided.
Compare the two graphs. Describe their similarities.
Both are concave up. Both have the same axis of symmetry. Both are the same width.
Describe their differences.
The graphs are shifted up and down.
Consider the role of in . How does the value in change the graph of ?
It moves the graph up one unit.
Graph the following functions
Press the start button if you wish to use the GeoGebra graphing tool. The GeoGebra tool will open in a new window, and can be used throughout this part of the learning activity.
(Opens in a new window)Start (Opens in a new window)Notebook
Using your notebook, compare all the graphs. Describe their similarities. Compare your answers with the suggestions provided.
Compare all the graphs. Describe their similarities.
All are concave up. All have the same width. All have the same axis of symmetry.
Describe their differences.
All are shifted up by their values.
How does the value of in transform the graph of ?
For in the graph will be translated k units up.
Investigation 8:
Think
Predict what the graph of might be like in comparison to the graph .
Translate the graph down unit.
Now, graph both functions using the graphing app. Was your prediction correct?
Press the start button if you wish to use the GeoGebra graphing tool. The GeoGebra tool will open in a new window, and can be used throughout this part of the learning activity.
(Opens in a new window)Start (Opens in a new window)Add to the above two functions by entering the following functions.
Notebook
When you have completed using the graphing app, use your notebook to complete the following questions. Check your answers with the suggested answers provided.
Compare all five graphs. Describe their similarities.
All are concave up. All have the same width. All have the same axis of symmetry.
Describe their differences.
All are shifted down by their k values.
How does the value of in transform the graph of ?
For in the graph will be translated units down.
Putting it all together: , , and in
Predict what the graph of might be like in comparison to the graph .
Answers will vary but should address how you think the , , and , values will affect the graph.
Graph both functions using the following graphing app.
Press the start button if you wish to use the GeoGebra graphing tool. The GeoGebra tool will open in a new window, and can be used throughout this part of the learning activity.
(Opens in a new window)Start (Opens in a new window)Notebook
When you have completed using the graphing app, use your notebook to complete the following questions. Check your answers with the suggested answers provided.
Was your prediction correct?
Stretch vertically by . Translated to the right . Translated up .
Add the function to your graph. Compare the three graphs. Describe their similarities.
All parabolas, just transformed.
Describe their differences.
Different vertex. Different widths. Direction of opening is different.
How has the graph of been transformed to get the graph of ?
Vertically stretched by .
Horizontally translated units right
Vertically translated unit up.
How has it been transformed to get the graph of ?
Reflected about the axis
Vertically stretched by
Horizontally translated units right.
Vertically translated unit up.
Add the following two functions to your graph:
Press the start button if you wish to use the GeoGebra graphing tool. The GeoGebra tool will open in a new window, and can be used throughout this part of the learning activity.
(Opens in a new window)Start (Opens in a new window)Notebook
When you have completed using the graphing app, use your notebook to complete the following questions. Check your answers with the suggested answers provided.
Compare your two graphs. Describe their similarities.
Both are compressed. Both have moved right four and up .
Describe their differences.
They are reflections of each other about the -axis.
How has the graph of been transformed to get the graph of ?
Vertically compressed by .
Horizontally translated units right.
Vertically translated unit up.
Compare all five graphs. Use the observations you made previously to write a general statement that describes the roles of , , and in the equation .
When a is negative, it is reflected about the -axis.
For or , the parabola is stretched vertically by the positive a value.
For and , the parabola is compressed vertically by the positive a value.
For , the parabola is translated horizontally units right.
For , the parabola is translated horizontally units left.
For , the parabola is translated vertically units up.
For , the parabola is translated vertically units down.
Now it is time to consolidate your skills and knowledge.

Reflection on the function :
| Reflection | Mathematical form | Effect |
|---|---|---|
| Vertical | Compared to , the graph of is a vertical reflection across the x-axis. The point (x,y) on becomes the point (x,-y) on |
Stretches on the function :
| Stretch | Mathematical form | Effect |
|---|---|---|
| Vertical | If a > 1, the graph is vertically expanded by a factor of a. If 0 < a < 1, the graph is vertically compressed by a factor of a. The point (x,y) on becomes the point (x,ay) on |
Translations on the function :
| Translation | Mathematical form | Effect |
|---|---|---|
| Horizontal | Compared to the graph of , the graph of is a horizontal translation of h units. when h > 0 the graph is horizontally translated to the RIGHT h units. when h < 0 the graph is horizontally translated to the LEFT h units. The point (x,y) on becomes the point (x+h,y) on |
|
| Vertical | Compared to the graph of , the graph of is a horizontal translation of k units. when h > 0 the graph is vertically translated to the RIGHT k units. when h < 0 the graph is vertically translated to the LEFT k units. The point (x,y) on becomes the point (x,y + k) on |
Math journal

At the end of the course, you will fine-tune 8 entries (two from each unit) from your math journal and submit them as your “Culminating assessment - Math journal” (Opens in new window)
Quadratic transformations summary
Summarize quadratic transformations in your math journal with the findings from the investigations. It may resemble the following examples.
The following section shows the graph of compared to the graph of where the given parameter changes.
Parameter:
or
Transformations related to
The graph of is vertically stretched by the positive a value. The resulting parabola is narrower than .
It is concave up when a is positive and concave down when is negative, meaning it was reflected about the -axis.
Parameter:
Transformations related to
The graph of is vertically compressed by the positive a value . The resulting parabola is wider than .
It is concave up when a is positive and concave down when a is negative, meaning it was reflected about the -axis.
Parameter:
Transformations related to
The graph of is translated or shifted horizontally by h units to the right.
Parameter:
Transformations related to
The graph of is translated or shifted horizontally by units to the left.
Parameter:
Transformations related to
The graph of is vertically translated up by units.
Parameter:
Transformations related to
The graph of is vertically translated down by units.
If you want more practice with domain and range, examine an interactive tool by entering “transformations of functions” and “Mark Kreie” into your preferred internet search engine. You are encouraged to search for additional materials to support your understanding.
Once you are comfortable with the success criteria, complete the following quiz to assess your progress.
Try “Diagnosing transformations: the value of a in the equation .”
Now you are ready to investigate further with the following application called “Investigation of transformations: Value of and in .”
Write a short paragraph explaining what you explored and how the h values affect the graph. What happens to the graph when the value increases? Decreases? Submit your answer to your portfolio for feedback.
Connecting and in
How do the values and in transform the graph of ?
, the graph is reflected about the axis and has a stretch by the positive value.
, the graph is reflected about the axis and has a compression by the positive value.
, the graph has a compression by the value.
, the graph has a stretch by the positive value.
, the graph is translated horizontally units to the left.
, the graph is translated horizontally units to the right.
Analyze the following parabola:
Analyze the following parabola:
Analyze the following parabola and sketch its graph.
Tips for sketching parabola
Determine two symmetrical points.
The following is true for any two symmetrical points on the parabola:
- They lie on opposite sides of the axis of symmetry.
- They have the same -value (so they can be connected by a horizontal line segment).
- They are the same distance from the axis of symmetry.
Since the axis of symmetry is , pairs of symmetrical points can be found using -values that are the same distance but on opposite sides of .
Some possibilities are:
- and (which produce points that are one unit on either side of )
- and (which produce points that are two units on either side of )
- and (which produce points that are three units on either side of )
Choose and . Substitute into the equation to find the corresponding -value. Both points have the same -value, so two symmetrical points are and .
Use the information you gathered to sketch the graph using pencil and paper.
Analyze the following parabola and sketch its graph.
Use the information you gathered to sketch the graph using grid paper. To sketch a graph of the function, mark the vertex and the two symmetrical points and on a grid. Join the points using a smooth curve to draw a parabola like the one in the following answer.
Write a quadratic function that satisfies these two sets of transformations.
Now you can test your knowledge and skill with the following application called “Diagnosing transformations in the equation .”
 Start (Opens in a new window)
 Now, you’ll be given another opportunity to test your knowledge of the transformations caused by the values of and in the quadratic equation .
For each graph, explain its transformation of the parent function .
The graph of has been translated to the right units.
The graph of has been translated to the left units.
The graph of has been translated up units.
The graph of has been translated down units.
The graph of has been translated to the left units and down unit.
The graph of has been translated to the right units and down unit.
The graph of has been translated to the left units and up unit.
The graph of has been translated to the right units and up .
The graph of has been translated to the right unit and up unit.
The graph of has been translated to the left unit and down unit.
Summary of the effect of and on the transformation of
|
Equation |
Graph |
Summary |
|---|---|---|
|
|
When (positive), the graph of and are similar because they are the same shape (width) and concave up. They are different because the graph of is horizontally shifted (translated) to the right units to get the graph of . The vertex of the transformed graph is . |
|
|
|
When (negative), the equation becomes or . The graphs of and are similar because they are the same shape (width) and concave up. They are different because the graph of is horizontally shifted (translated) to the left units to get the graph of . The vertex of the transformed graph is . |
|
|
The graph of , for , is a vertical translation (or shift) of the graph of . When is a positive number, is translated up units. |
||
|
The graph of , for , is a vertical translation (or shift) of the graph of . When is a negative number, is translated down units. |
||
|
In comparison to the graph of , the graph of represents a horizontal translation of units (right when is positive or left when is negative), and a vertical translation of units (either up or down). |