
In this learning activity, we will learn about creating a table of values and we will graph and analyze real life situations involving quadratic relationships.
During the following learning activity, you will be analyzing four different parabolic relations. Examine each image and think of any questions you may have about the situation.
Carousel content with 4 slides

Question 1 – Glider height
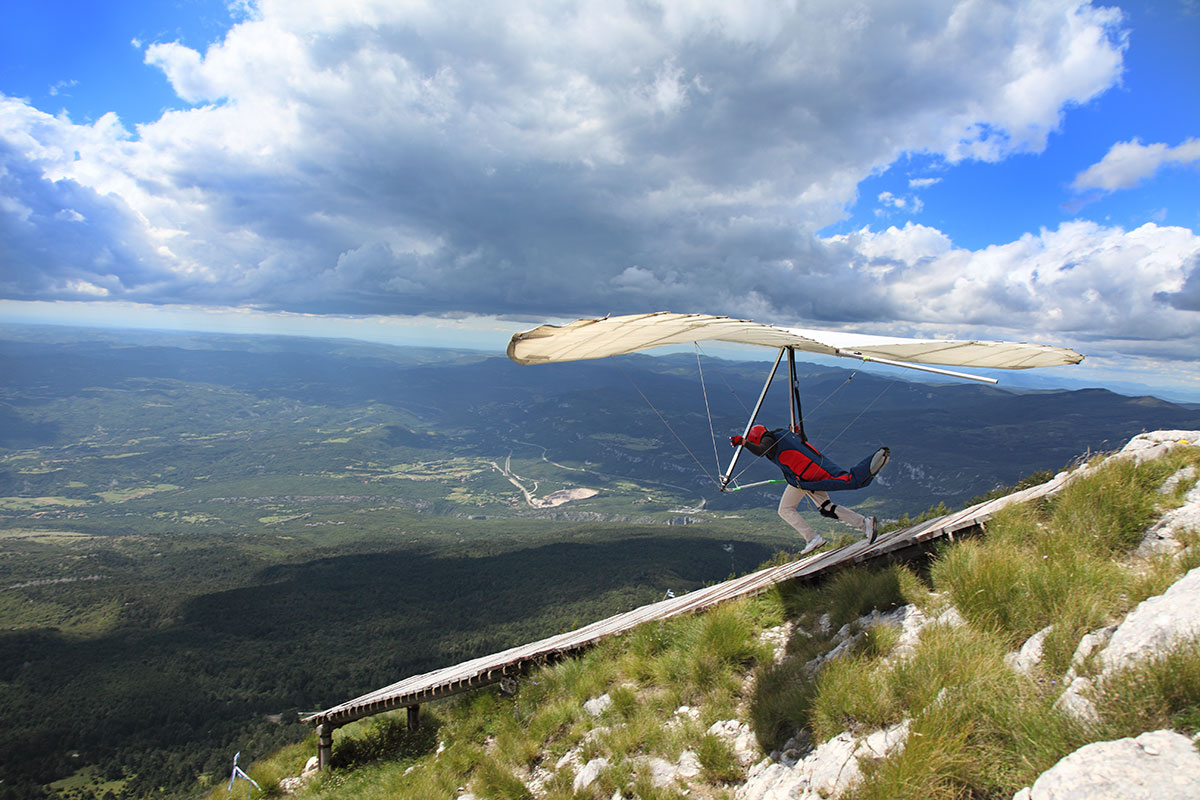
Nikisha is flying in a hang glider and starts from a 9 m tower on top of a hill. They record the height above the hill (the hill height is represented by the height 0 m) for 20 seconds. That information is shown in the following table.
| Time(s) | Height(m) |
|---|---|
| 0 | 9 |
| 1 | 5.5 |
| 2 | 2.5 |
| 3 | 0 |
| 4 | -2 |
| 5 | -3.5 |
| 6 | -4.5 |
| 7 | -5 |
| 8 | -5 |
| 9 | -4.5 |
| 10 | -3.5 |
| 11 | -2 |
| 12 | 0 |
| 13 | 2.5 |
| 14 | 5.5 |
| 15 | 9 |
| 16 | 13 |
| 17 | 17.5 |
| 18 | 22.5 |
| 19 | 28 |
| 20 | 34 |
Consider the following questions about the hang glider and confirm your answers by checking the suggested solutions.
a) Does the table represent a quadratic function? How do you know?
You could have sketched the data points to examine if it forms a parabola:
You also could have determined the first and second differences:
The second differences were all 0.5.
b) Determine the equation that represents the situation using appropriate variables.
Hint: It may be helpful to identify the -intercepts and use the factored form of the quadratic. Make sure you solve for the ‘’ value.
The zeros of the situation are (3,0) and (12,0), when and .
Sub in any point to solve for .
Final equation:
Explore this!

You can use the vertex method to find an equation from the graph.
Now, let’s review the following video for the learning more about finding the equation of quadratic functions from a graph!
Explore this!
You can also perform a quadratic regression on a graphing app such as GeoGebra to determine the equation. The steps for this are outlined in the video “Quadratic Regression using GeoGebra.”
The data points of Nikisha flying a hand glider are presented again in the following. Perform another quadratic regression on a graphing app.
| Time(s) | Height(m) |
|---|---|
| 0 | 9 |
| 1 | 5.5 |
| 2 | 2.5 |
| 3 | 0 |
| 4 | -2 |
| 5 | -3.5 |
| 6 | -4.5 |
| 7 | -5 |
| 8 | -5 |
| 9 | -4.5 |
| 10 | -3.5 |
| 11 | -2 |
| 12 | 0 |
| 13 | 2.5 |
| 14 | 5.5 |
| 15 | 9 |
| 16 | 13 |
| 17 | 17.5 |
| 18 | 22.5 |
| 19 | 28 |
| 20 | 34 |
Solution:
The resulting equation for this curve produced by a quadratic regression app is .
c) Confirm the equation you found in b) is the same as the quadratic regression equation.
Hint: You can convert from factored form to standard form to find out if they are the same by expanding and simplifying.
After expanding and simplifying factored form, we identify it is the same as the standard form that was produced during the quadratic regression.
d) What is the lowest point the glider reaches?
Hint: You are trying to find out the optimal value or the -value of the vertex.
The glider reaches the lowest point, 5.0625m below the hill top after 7.5 seconds.
You could use the factored form to find the axis of symmetry and then the optimal value:
Find the axis of symmetry:
Find the optimal value.
The glider reaches the lowest point, 5.0625 m below the hill top after 7.5 seconds.
You could have used the standard form and completed the square:
The glider reaches the lowest point, 5.0625 m below the hill top after 7.5 seconds.
Question 2 – Birth rate
A real-world situation that can be modelled by a quadratic function is the trend for births during the period known as the baby boom years. This term refers to the time period after World War II when there was a noticeable increase in births due to a large number of Canadian soldiers returning from the war and starting families. Because of this increase in birth rate, the baby boomer generation gave birth to the Millennial generation.
Statistics Canada is the government agency that collects data regarding such matters. This exercise will help you find the relevant data on the Statistics Canada website, graph the data using the graphing app, and then determine the equation of best fit.
Note: The Canadian baby boom data will be provided to you at the end of this exercise so don’t worry if you don’t have access to Statistics Canada’s website at this time. You can still work through the various questions related to this example.
Try it!

Step 1: Access Statistic Canada’s website.
How would you locate Statistics Canada’s website?
You would likely perform an Internet search using your favourite search platform using the search terms “Statistics Canada”.
The direct link is https://statcan.gc.ca/
Step 2: Access the CANSIM database by clicking the ‘data’ tab.
Browse the Statistics Canada website for the CANSIM database page. Do some research about CANSIM. What is it?
CANSIM is the socioeconomic database that Statistic Canada updates on a daily basis. You can use the CANSIM database to run reports and download data about most aspects of Canada’s social and economic climate, both past and present.
Step 3: Retrieve the data table related to Canada’s annual number of births.
Specifically, you want to open the data table labelled Estimates of births, by sex, annual. In the CANSIM directory, which section do you think you need to access in order to find the number of births in Canada each year?
You need to access the ‘health’ category at the left side. You would then click on the ‘pregnancy and births’ category. Finally, open the ‘births and birth rates’ category. Then you would access vital statistics, and browse for the relevant data table.
Step 4: Configure the data table to show only the number of births from 1985 to 1995.
How would you configure the data table to show only those births in Canada that occurred between 1985 and 1995?
Select ‘Add/Remove data’
Set up the time frame for the data, specifically from 1985 to 1995.
Next, you can choose whether to display the time as rows or columns. For easier reading, you might want to display the time as rows (i.e., the data will display vertically).
Step 5: Download your data.
How might you go about downloading your data table to your computer?
Access the tab that allows you to download data. From there, you can configure the language, how the table is displayed, and the file format of the final data table. There are many options available.
Under ‘Customize layout display’: Geography as Row; Sex as Column; Reference period as Row.
Your final table displaying the number of births from 1985 to 1995 should resemble the following data table.
| Reference period | Both sexes | Males | Females |
|---|---|---|---|
| 1985/1986 | 375,381 | 192,846 | 182,535 |
| 1986/1987 | 373,022 | 190,848 | 182,174 |
| 1987/1988 | 370,033 | 189,399 | 180,634 |
| 1988/1989 | 384,035 | 196,898 | 187,137 |
| 1989/1990 | 403,280 | 206,835 | 196,445 |
| 1990/1991 | 402,929 | 207,004 | 195,925 |
| 1991/1992 | 403,107 | 206,632 | 196,475 |
| 1992/1993 | 392,181 | 201,613 | 190,568 |
| 1993/1994 | 386,159 | 198,399 | 187,760 |
| 1994/1995 | 381,998 | 196,326 | 185,672 |
| 1995/1996 | 372,453 | 190,697 | 181,756 |
Source: Statistics Canada.
Now you will use the GeoGebra graphing app to plot the data, draw the parabola of best fit, and find the equation for this parabola. For your graph, let represent the number of years since 1985 (enter 0 for 1985, 1 for 1986, and so on).
The equation you should get (with coefficients rounded to the nearest tenth) is:
Follow the instructions given earlier to access the Statistics Canada website with the following modification: you will find the data for Canadian births for the years January 1987 to December 2000.
In your notebook, create a table of values to record the data.
Your data table should resemble the following:
| Year | Number of births |
|---|---|
| 1987 | 369,742 |
| 1988 | 376,795 |
| 1989 | 392,661 |
| 1990 | 405,486 |
| 1991 | 402,533 |
| 1992 | 398,643 |
| 1993 | 388,394 |
| 1994 | 385,114 |
| 1995 | 378,016 |
| 1996 | 366,200 |
| 1997 | 348,598 |
| 1998 | 342,418 |
| 1999 | 337,249 |
| 2000 | 327,882 |
Use any graphing app to plot the data, graph the parabola of best fit, and find the equation for the parabola of best fit. Similar to the previous example, let represent the number of years since 1987 (enter 0 for 1987, 1 for 1988, and so on).
Your graph should resemble something like the following.
The equation rounded to the nearest tenth is
Question 3 – Gravity on planets
On any planet, the formula represents the height of an object that is allowed to fall freely from a given height .
In this formula, represents the height in metres, after seconds; is the planet’s acceleration due to gravity, and is the height from which the object is dropped.
Gravity is measured on different planets in terms of acceleration. In other words, when you drop an object it will accelerate toward the ground at a steadily increasing speed. If you ignore wind resistance, the speed increases as long as the object falls.
The more massive a planet is, the greater its acceleration due to gravity.
Speed is often measured in metres per second, abbreviated as . Acceleration due to gravity is measured as the rate an object’s speed (in metres per second) increases each second, abbreviated as (metres per second, per second).
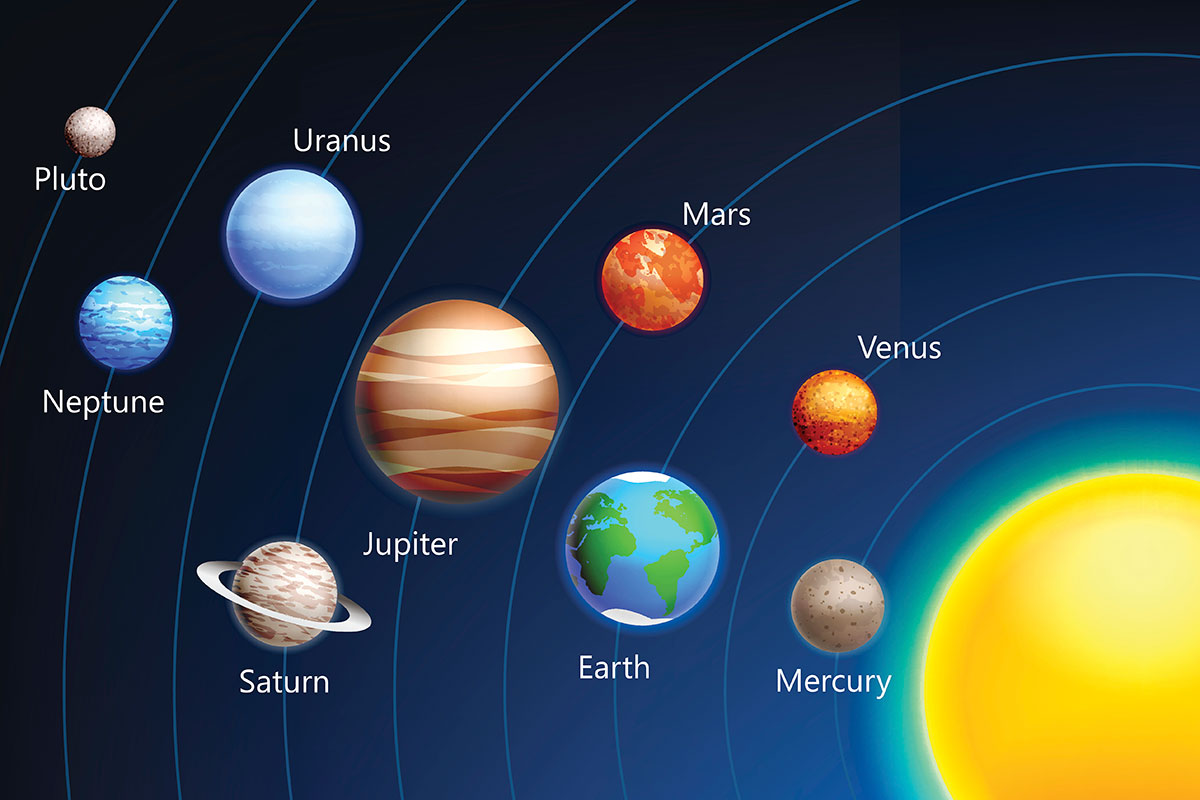
The following chart lists some planets and their associated acceleration due to gravity.
| Planet | Acceleration due to gravity |
|---|---|
| Earth | |
| Venus | |
| Mars | |
| Saturn | |
| Neptune |
a) Based on the equations just explored, on which planet will the rock fall the quickest? Explain.
Neptune
Examining the ‘’ values for each graph. The larger the ‘’ value, the narrower the parabola. Also, the larger the step pattern multiplier, meaning it decreases quicker. The planet that has the largest ‘’ value is Neptune.
b) Based on the equations just explored, on which planet will the rock fall the slowest? Explain.
Mars
Examining the ‘’ values for each graph. The smaller the ‘’ value, the wider the parabola. Also, the smaller the step pattern multiplier, meaning it decreases slower. The planet that has the smallest ‘’ value is Mars.
c) Graph each previous equation on the same grid using a method of your choice.
d) How do the graphs support the conclusion that the rock falls fastest on Neptune and the slowest on Mars? Explain.
From the graph, you can notice that the parabola representing Neptune has a -intercept at approximately 6.7 s, while the -intercept for Mars is approximately 11.6 s.
Therefore, the rock falls the fastest on Neptune and the slowest on Mars.
Question 4 – Rocket launching
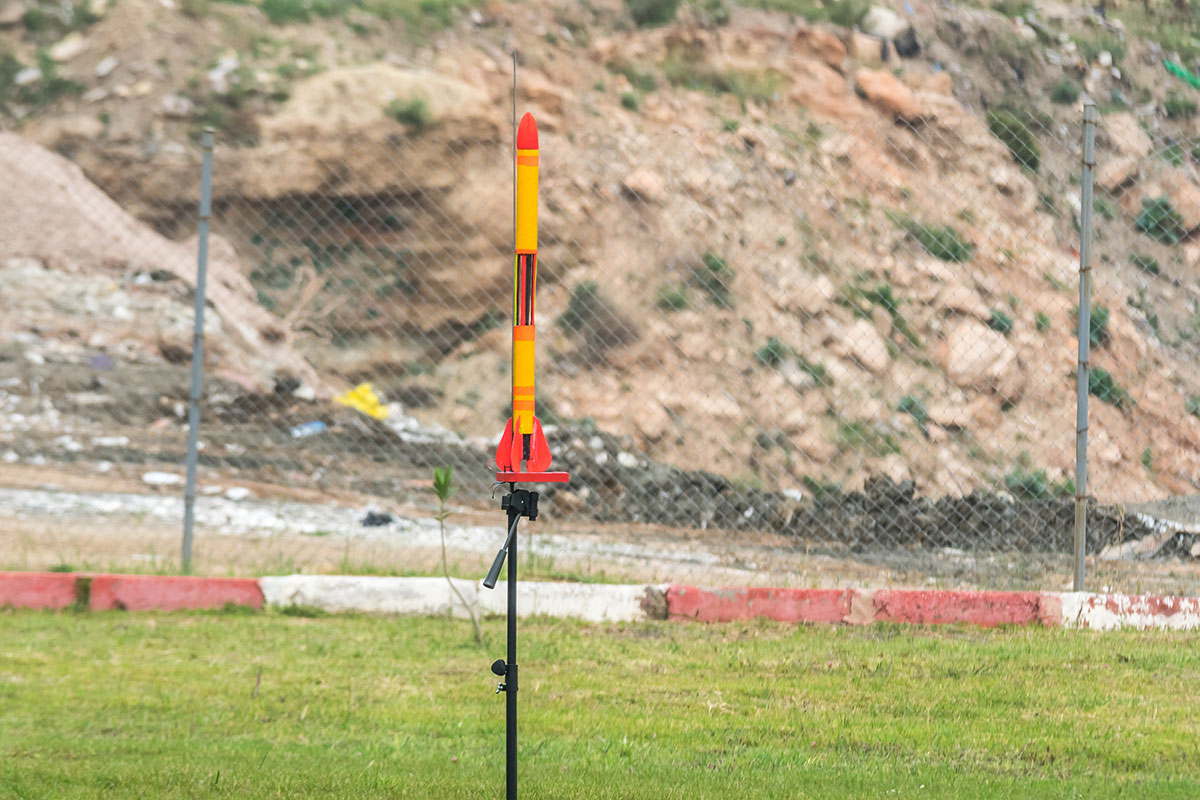
Miguel launches a model rocket straight upward with an initial velocity of 100 m/s from a platform that is 10 m high. The height , in metres, of the rocket, after seconds, is modelled by the equation , where .
Answer the following questions about the rocket and confirm your answers by checking the suggested solutions.
a) Determine the maximum height of the rocket. After how long will the rocket reach this maximum?
Hint: You are trying to find the vertex.
The rocket has a maximum height of 510 m and it reaches this height after 10 seconds.
Converting to vertex form by completing the square
Solving for the -intercepts, then finding the axis of symmetry, and the optimal value
b) After how long will the rocket reach the ground?
Hint: You are trying to find the t-intercept.
We can ignore the negative -intercept as time must be positive.
The rocket will reach the ground after approximately 20.1 seconds.
c) Sketch the parabola.
Hint: You can use the information you found already.
You found previously that the vertex is (10,510) and the -intercepts are (-0.0995,0) and (20.0095,0). You can plot those points and connect them with a curve.

Review

Summary
The following are some steps that you can take to analyze/determine the equation of a real-life situation that models a quadratic function:
- Create table of values by thinking carefully about the independent and dependent variable in that situation.
- Create a graph from these table of values using GeoGebra and label it.
- Use Vertex method or Factored method to find the equation that represents this situation. Alternatively, use any graphing software to determine the equation.
- Quadratic Formula can be used to solve any given quadratic equation. Alternatively, you can use factoring methods to solve a quadratic equation.
Self-check
Rate your level of understanding from 1 (I am still confused) to 5 (I fully understand this concept) based on your results from the questions you just completed.
I am able to:
If there are any criteria where you rated your level of understanding a 3 or below, you should review the concepts before moving on to the next learning activity.
Math journal

Remember that at the end of the course, you will fine-tune 8 entries (two from each unit) from your math journal and submit them as your “Culminating Assessment - Math journal.” (Opens in new window)
Summarize how you can determine the x-intercepts and the vertex. Include as many methods as possible. It may be helpful to include an example of each in a table you create like this one.
| Parabola | Method 1 | Method 2 | Method 3 | Method n |
|---|---|---|---|---|
| x-intercepts |
Take two pictures of representations of quadratic relations in the real-world and put them in your math journal. Try to determine an appropriate equation for each; you can use GeoGebra to help.
Assessment Opportunity - Journal Submission

Journal Entry (Assessment Opportunity)
To prepare you for the culminating assessment, you have the opportunity to submit a journal entry from this unit to be assessed (no grade will be recorded) for feedback before the final culminating assessment. It will be assessed according to the culminating assessment rubric found below. You may choose to make any updates of suggestions and submit it for the culminating assessment at the end of the course. Though you will not receive a grade for this submission, the rubric is being included to remind you of the feedback that the teacher will be using to assess your final math journal submissions towards the end of the course.
Feedback and marking
You may receive the following forms of feedback:
- Your teacher may highlight the phrases on the rubric that best describe your assignment to show you how you have done.
- Your teacher may also provide you with detailed comments about the strengths of your assignment, the areas of the assignment that need improvement, and the steps you should take before submitting another assignment like this one.
Pay careful attention to the following rubric. Your teacher will use it to assess your work. You should refer to it too, so you’ll know exactly what your finished assignment should appear like.
Success Criteria:
- knowledge of relevant and appropriate skills and procedures
- knowledge of relevant and appropriate facts and terms
- understanding of the meaning of the mathematical content
| Level 4 | Level 3 | Level 2 | Level 1 |
|---|---|---|---|
| With a high degree of effectiveness | With considerable effectiveness | With some effectiveness | With limited effectiveness |
Success Criteria:
- logical interpretation of problem
- evidence of modelling the problem, drawing conclusions, or justifying reasoning
| Level 4 | Level 3 | Level 2 | Level 1 |
|---|---|---|---|
| With a high degree of effectiveness | With considerable effectiveness | With some effectiveness | With limited effectiveness |
Success Criteria:
- math vocabulary used accurately
- math notation and symbols used appropriately
- algebraic solutions, graphs, charts, diagrams organized and clearly written
- mathematical thinking expressed clearly reflection on mathematical thinking expressed clearly
| Level 4 | Level 3 | Level 2 | Level 1 |
|---|---|---|---|
| With a high degree of effectiveness | With considerable effectiveness | With some effectiveness | With limited effectiveness |
Success Criteria:
- relevant and appropriate selection of facts, skills, procedures
- relevant and appropriate connections made between math concepts
- relevant and appropriate connections made between math and the world outside the classroom
| Level 4 | Level 3 | Level 2 | Level 1 |
|---|---|---|---|
| With a high degree of effectiveness | With considerable effectiveness | With some effectiveness | With limited effectiveness |
The teacher will assess your work using the rubric. Before submitting your assessment, review the rubric to ensure that you are meeting the success criteria to the best of your ability.
When you are ready, submit your assessment by pressing the “Submit Your Work” button and follow the submission directions.

(opens in a new window)