
During this learning activity, you will investigate the properties of exponential functions and compare graphs of exponential functions with that of linear and quadratic functions.
Exponential function has the form for some real number , where . Here the exponent is a variable.
Natural exponential function is an exponential function with the base '' and is of the form , where the base '' is Euler's constant.
Portfolio

In your notebook create a table of values for this equation with and values of from to . From that table of values create a rough sketch of the graph those values would produce, examine it closely and try to determine if the shape of the curve is familiar.
Submit your portfolio item(s) by pressing the “Go To Portfolio” button.
 (Opens in new window)(opens in a new window)
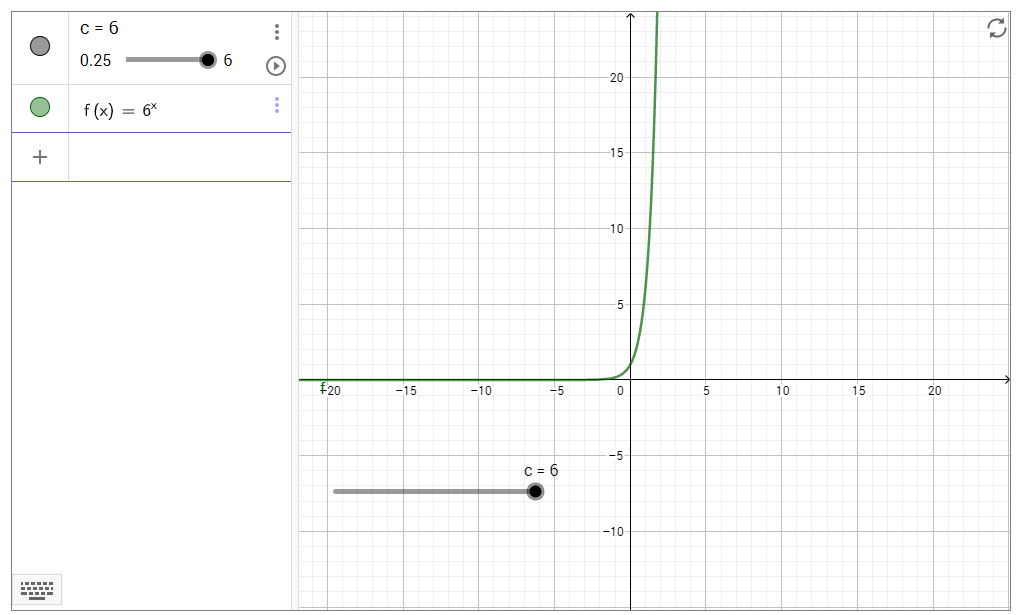
If you choose, you may use the following Investigating Exponential Functions of the form to familiarize yourself with the equation and what it appears on a graph.
- How does the shape of the graph change as the slider moves?
- How does the steepness of the graph change?
- Does the graph ever go below the x-axis? Why or why not?
- Are there any points on the curve which do not change?
 (Opens in a new
window)
Start (Opens in a new
window)
(Opens in a new
window)
Start (Opens in a new
window)

Comparing linear, quadratic, and exponential functions
Use what you have learned so far about linear, quadratic, and exponential functions to identify the degree and classify the type of the following two functions.
Try it!

It is degree one, therefore, it is a linear function.
It is degree two, therefore, it is a quadratic function.
Let’s review how to determine the degree of the function
This function has a numerical base and a variable exponent. Since it is not a polynomial function, it has no degree. These types of functions are called exponential functions.
In general, an exponential function is in the form , where
- (to review the meaning of the symbols, refer to Learning Activity 2.2)
Compare the following graphs to each other.
Think

In general, what type of function do they both resemble?
To investigate further, let’s consider the following tables of values for the two graphs we’ve been examining.
| Table for graph 1 | |
|---|---|
| Table for graph 2 | |
|---|---|
As we learned earlier in the course, to determine if a relation is linear, the first differences must be constant. For a relation to be quadratic, the second differences are constant.
These first and second differences are called finite differences. To determine if a function is exponential, we want a constant ratio of finite differences.
Graph 1 and graph 2 seem similar because you can only observe part of the graphs, that is, the part for positive values of .
In the following pair of graphs, you will notice that each graph is represent differently for positive and negative values of and the equations are given. One graph is a parabola and one graph is not.
Notebook

The following is a summary of how to determine from a table of values if a function is linear, quadratic, or exponential. Complete a chart like this chart and check your answers with the suggested observations.
| Function | Form of equation | Finite difference observations | Suggested observations |
|---|---|---|---|
| Linear | First differences are constant. | ||
| Quadratic | Second differences are constant. | ||
| Exponential | Ratio of second differences is constant. |
Graphs of exponential functions
Explore this!

You can draw a graph of exponential function using table of values of function. Explore the following video to learn more.
Notebook
Investigate for equations 1 and 2 in your notebook. Then complete tables like the following and plot your graphs, answering the questions that follow each graph.
Equation 1
Complete a table like the following table for :
| Suggested solution | ||
|---|---|---|
Notebook
In your notebook, plot the points on a grid and then connect them with a smooth curve.
Use the graph to determine the - and -intercepts.
As you learned in Learning Activity 2.2, the domain of a function is the set of all the possible input values. You may want to review this learning activity again. These values are indicated along the horizontal axis of the graph of
Use the graph of to determine the domain of this function.
Since all real numbers are possible, the domain is .
Is the function increasing or decreasing? Explain.
As the -values increase from left to right, the -values also increase; therefore, the function is increasing.
Again, consider what you learned in Learning Activity 2.2; the range of a function is the set of all the output values. You may want to review this activity. These values correspond to the values along the vertical axis of the graph of .
Use the graph of to determine the range of this function.
Since all the -values are greater than 0, the range is .
This line is said to be a horizontal asymptote for the graph of . What is the equation of this line?
The equation of this line, which is also the -axis, is .
Which axis does the graph come very close to but does not intersect?
The graph of comes very close to the -axis, but does not touch or cross it.
Does the graph of have a minimum or maximum point? Explain.
Since the graph of is always increasing, it does not have a minimum or maximum point.
Notebook
Complete a table like the following table for equation 2: in your notebook.
| Suggested solution | ||
|---|---|---|
In your notebook, plot the points on a grid and then connect them with a smooth curve.
Use the graph to answer the following questions. What are the - and -intercepts?
What is the domain and range?
The domain is .
The range is .
Is the function increasing or decreasing? Explain.
As the -values increase from left to right, the -values also increase; therefore, the function is increasing.
Is there a minimum or maximum point?
State the equation of the asymptote for this graph.
Compare the graphs of and . How are they similar?
Similarities between the graphs of and include the following:
- no -intercept,
- the -intercept is (0,1),
- the graphs are increasing,
- there is no minimum or maximum point, and
- the equation of the asymptote is .
How are they different?
Notebook
Investigate properties of , for these equations to answer the questions that follow in your notebook:
Predict how the graphs of these equations might be similar to the graph of .
They will be similar to the graph of in that they will have
- no -intercepts
- -intercepts of (0,1)
- the graphs will be increasing
- no minimum or maximum points
- the asymptotes will be
Predict how the graphs of these equations might be different from the graph of .
Now, it’s time to test your predictions. Use this (or any other) graphing app to graph the four functions from the investigation (, , ,) together with . (Note: To use an exponent on the graphing tool, to use the "^" sign (i.e. y=2^x)
 (Opens in a new
window)
Start (Opens in a new
window)
(Opens in a new
window)
Start (Opens in a new
window)
Compare the graphs. Were your predictions correct? If not, explain why.
Answers may vary. You may have noticed you were correct for some of the equations and not for others.
What features do all the graphs share in common?
All the graphs feature:
- no -intercepts
- the -intercepts are all (0,1)
- the graphs are increasing
- the asymptotes are all
What makes the graphs different?
How quickly the graphs are increasing changed; the larger the base, the quicker the graph is increasing.
Use your observations to make conclusions about the graphs of for .
The graphs of for have the following properties:
- no -intercepts, -intercepts are (0,1)
- are increasing
- have no minimum or maximum points
- the horizontal asymptotes are the -axis or
- increase quicker for larger values of the base
Example 1
Without graphing, state the intercepts, domain, and range for the graph of the exponential function .
There is no -intercept. The -intercept is (0,1).
The domain is . The range is .
Again, without graphing, state the intervals of increase or decrease and the minimum or maximum point for the graph of the exponential function .
The graph is increasing for .
There is no minimum or maximum point.
Again, without graphing, state the equation of the horizontal asymptote for the graph of the exponential function .
The horizontal asymptote is the
Example 2
Without graphing, describe the similarities between the graphs of , , and .
- There are no x-intercepts. The -intercepts are all (0,1).
- The domain is . The range is .
- The graphs are increasing for .
- There are no minimum or maximum points.
- The horizontal asymptotes are either the -axis or .
Without graphing, describe the differences between the graphs of , , and .
The graphs will differ only in how quickly they are increasing. The higher the base, the quicker the graph will increase; therefore, the order from quickest increasing to slowest increasing is , , and .
Notebook
Investigate properties of , by completing the table like the following for equation 1, and equation 2:
Complete a table like the following table for in your notebook.
| Suggested solution | ||
|---|---|---|
In your notebook plot the points on a grid and then connect them with a smooth curve.
Use the graph to answer the following questions.
What are the - and -intercepts?
What is the domain and range?
The domain is .
The range is .
What are the values of for which the function is increasing or decreasing?
The graph is decreasing for .
Is there a minimum or maximum point?
State the equation of the horizontal asymptote for this graph.
The horizontal asymptote is the -axis or .
Equation 2
Complete a table like the following table for in your notebook.
| Suggested solution | ||
|---|---|---|
In your notebook plot the points on a grid and then connect them with a smooth curve.
Use the graph to answer the following questions.
What are the - and -intercepts?
There is no -intercept. The -intercept is (0,1).
What is the domain and range?
The domain is .
The range is .
What are the values of for which the function is increasing or decreasing?
The graph is decreasing for .
Is there a minimum or maximum point?
State the equation of the horizontal asymptote for this graph
The horizontal asymptote is the -axis or .
Compare the graphs of and :
How are they similar?
Similarities between the graphs include:
- no -intercepts
- the -intercepts are (0,1)
- the graphs are decreasing,
- there are no minimum or maximum points
- the horizontal asymptotes are
How are they different?
As the values of increase, the graph of decreases more quickly than the graph of .
Use these equations to answer the questions that follow in your notebook:
Predict how the graphs of these equations will be similar to the graph of .
The graphs will have the same properties as the graph of
Now, it’s time to evaluate your predictions from this investigation. Use any graphing app to graph the four functions from the investigation along together with . Compare the graphs.
Were your predictions correct? If not, explain why.
Answers may vary. You may have noticed you were correct for some of the equations and not for others.
What features do all the graphs have in common?
All the graphs have:
- no -intercepts
- the -intercepts are (0,1)
- the graphs are decreasing
- the horizontal asymptotes are
What makes the graphs different?
Each graph decreases differently. The smaller the base, the faster the graph decreases. So bases that are closer to 1 will have graphs that are flatter than those with bases that are closer to 0.
Use your observations to make conclusions about the graphs of for .
The graphs of for have the following properties:
- There are no -intercepts. The y-intercepts are (0,1).
- The domain is . The range is .
- The graphs decrease for .
- There are no minimum or maximum points.
- The horizontal asymptotes are the -axis or .
- The graphs decrease more quickly for values of the base closer to 0.
Example 1
Without graphing, state the following for the graph of the exponential function .
- and -intercepts:
There is no -intercept. The -intercept is (0,1).
Domain and range:
The domain is . The range is
Intervals of increase or decrease:
The graph of is decreasing for .
Minimum or maximum point:
There is no minimum or maximum point.
Equation of the horizontal asymptote:
Example 2
Without graphing, describe the similarities and difference between the graphs of , , and .
Similarities:
Similarities include:
- There are no -intercepts. The -intercepts are (0,1).
- The domain is . The range is .
- The graphs are decreasing for .
- There are no minimum or maximum points.
- The horizontal asymptote is the -axis or .
Differences:
The graphs will differ only in how quickly they decrease. The closer the value of the base is to 0, the more quickly it decreases. Change each base into a decimal to determine which fraction is smaller and which is larger.

Review

Let us summarize the properties of exponential function
- Exponential function is of the form or .
- The function is exponential only if and .
- Domain of exponential functions is set of all real numbers and Range is set of all positive real numbers.
- All exponential functions have Horizontal Asymptote at , where Asymptote is the line that tends to approach the curve but never touches it.
- Exponential function has y-intercept at (0,1).
- If then Exponential function is increasing function representing rapid growth.
- If Exponential function is decreasing function representing rapid decay.
- One can identify a function is exponential from table of values if successive values in the table are in constant ratio.
Self-check
Rate your level of understanding from 1 (I am still confused) to 5 (I fully understand this concept) based on your results from the questions you just completed.
I am able to:
If there are any criteria where you rated your level of understanding a 3 or below, you should review the concepts before moving on to the next learning activity.
Math journal
At the end of the course, you will fine-tune 8 entries (two from each unit) from your math journal and submit them as your “Culminating Assessment - Math journal” (Opens in new window)
Notebook
Consider your findings from the investigations about exponential function properties. Answer the following questions in your notebook. You can use the suggested answers to help you.
For the base of if what is the graph?
What are the properties of the graph?
- No -intercept.
- -intercept is (0,1).
- .
- .
- Decreases for .
- No minimum or maximum point.
- Horizontal asymptote is the -axis or .
- The closer the value of is to , the more quickly the graph decreases.
For the base of if
What is the graph?
What are the properties of the graph?
- No -intercept.
- -intercept is (0,1).
- .
- .
- Increase for .
- No minimum or maximum point.
- Horizontal asymptote is the -axis or .
- The larger the value of , the more quickly the graph increases.
Notebook
Identify each of the following functions as linear, quadratic, exponential, or none of these.
Notebook
The table of values for three different unknown functions is given. Identify each of the following functions as linear, quadratic, exponential, or none of these. Use finite differences to help with your identification.
Table A
This table of values represents an exponential function.
Table B
This table of values represents a linear function.
Table C
This table of values represents a quadratic function.
Further examples
Evaluate your understanding of exponential functions and their graphs. Identify each of the following functions as linear, quadratic, exponential, or none of these.
Try it!
The table of values for three different functions are given in the following. Identify what type of function each table represents.
Table A
What type of function is this?
This table of values represents a quadratic function.
Table B
What type of function is this?
This table of values represents a linear function.
Table C
What type of function is this?
This table of values represents an exponential function.
Try it!
Without graphing, state the following for the graph of this exponential function. (Compare your answers to the suggested answers.)
Try it!
Without graphing, state the following for the graph of this exponential function. (You can compare your answers by pressing the questions.)
Further examples
When comparing two investment opportunities, you are given the general equations of both :
Option 1:
Option 2:
Where represents the total amount of money you would have after time, , in years.
Which option should you choose to invest your money in and why?
You should choose option 1 because the base, is bigger than option 2’s base, , and therefore it increases at a greater rate.
When comparing two different car models, you are given the general equations of both options:
Option 1:
Option 2:
Where represents the total value of the car after depreciation and represents time in years.
Which option should you choose when choosing your car and why?
You should choose options 1 because the base, is larger than option 2’s base, , and therefore the value decreases at a slower rate.