
In this learning activity, you will identify real-world situations that can be modelled with periodic and sinusoidal functions. You will explore the graphs of these functions and understand the effect of applying transformation to such functions.
Real life periodic patterns and wave
A function that produces a graph that has a regular repeating pattern over a constant interval is called a periodic function.
Examine the following real-life examples and determine if its graph would be periodic.
Think


If we create a graph of this situation, would this be periodic?
No.
How do you know this is (or is not) periodic?
There is not a repeating pattern at regular intervals.
Think

If we create a graph of a situation where a person is swinging, would it periodic?
Yes, it could be periodic.
How do you know this is (or is not) periodic?
If the person swings at exactly the same speed and to the same height, it would be periodic.
Think

If we create a graph of ripples in water, would this be periodic?
Not periodic.
How do you know this is (or is not) periodic?
The ripples would continue to spread until the water surface was calm again; this is a pattern, but not a repeating pattern.
Think

If we create a graph of Newton’s cradle, would this be periodic?
In a world without friction, this would be periodic.
How do you know this is (or is not) periodic?
Ignoring friction and air resistance, the momentum of these would continue at the same height and speed.

Periodic functions
In previous learning activities, you learned how trigonometry can be used to solve problems that involve triangles. Another very important application of trigonometry is in solving problems that can be represented, or modelled, by periodic behaviour, which refers to quantities that change over time in a regular way.
Think

Can you think of examples in the real world that have a repeating pattern?
The rising and setting of the sun, the motion of a pendulum in a clock, the rise and fall of ocean tides, the rhythm of a human heartbeat, and a ride on a Ferris wheel.
Later in this learning activity, you’ll learn to solve problems that involve applications of periodic functions. In order to do this, however, it is first necessary for you to learn about the graphs of these important functions.
Graphing periodic functions
The following graph represents a periodic function because the graph has a pattern that repeats at regular intervals. When a function is periodic, one complete pattern is called a cycle. The period of the function is the horizontal length of one cycle (or the time it takes to complete one cycle).
Try it!

Try to identify the length of one cycle on this graph.
Hint: On the graph, identify the pattern for -values from to . The -values that make this pattern are repeated for -values from to .
The domain for one cycle is all of the -values in one complete cycle. For this graph, the period is units. One complete cycle begins at and ends at , a total of units.
Always use the horizontal (left to right) values on the graph to determine the period.
Definition

Equation of the axis is the equation of the horizontal line halfway between the maximum and the minimum value of the graph. It is given by
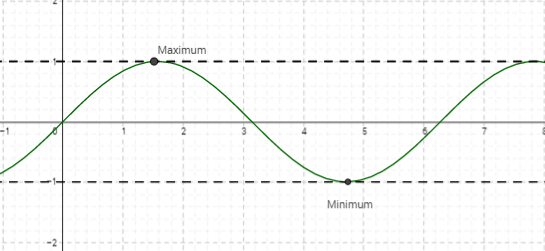
The amplitude of a periodic function is half the distance from the maximum (highest) value to the minimum (lowest) value. Always use the highest and lowest vertical (up and down) values on the graph to determine the amplitude.
In the previous graph, the maximum value is and the minimum value is . The distance between these two values is . Half of is . Therefore, the amplitude is .
Note that the amplitude can also be described as the maximum distance from a position of rest (or the middle position). Since the amplitude represents distance, it is always a positive value.
A formula for finding the amplitude of a periodic function is:
Before you examine a real-world example of a periodic function, review a protractor’s orientation on a Cartesian plane. A protractor is a device used to measure angles. A circle is divided into , which means that when it is divided into four parts, each quadrant represents . The following diagram is a protractor oriented for use on a Cartesian (, ) plane.
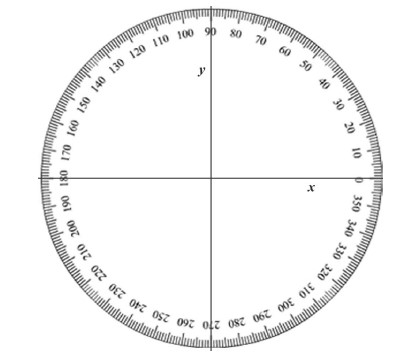
The following exercise illustrates the periodic pattern found in taking a ride on a Ferris wheel. The height is recorded relative to the -axis.
Notebook

You can use your notebook to complete each of the following questions. Compare your work with the suggested answers to check your understanding.

Consider the shape of a Ferris wheel. A Ferris wheel is a large, upright metal wheel with seats or enclosed gondolas mounted on its circumference. Have you ever noticed or ridden on a Ferris wheel? As a Ferris wheel rotates, your height above the ground changes as you ride up to the top and then down again.
At the local autumn fair, two friends take a ride on a Ferris wheel that has a diameter of . The following circle illustrates the Ferris wheel.
The friends enter a gondola shortly before the ride is completely full. The friends, located at point , begin their ride when the last gondola is loaded at point . The Ferris wheel turns counter-clockwise at a constant speed. The wheel takes one minute to complete one revolution. Point is the centre of the wheel and the origin of the - and -axis.
What are the coordinates of points , , , and ? Explain in your notebook and compare with the suggested answer provided.
Since the diameter of the Ferris wheel is , the radius is half of , which is . Each point , , , and , is on a radius of the circle. The coordinates of these points are given on the following diagram:
Use the points you found previously to complete the following table:
| Rotation of wheel (degrees) | Suggested answers |
|---|---|
| 0° | 0 |
| 90° | 10 |
| 180° | 0 |
| 270° | 10 |
| 360° | 0 |
| 450° | 10 |
| 540° | 0 |
| 630° | 10 |
| 720° | 0 |
In your notebook plot the points in the table on a graph with height on the vertical axis and degrees on the horizontal axis. Draw a curve of best fit to represent the data. Compare your work with the suggested answer provided.
Draw a horizontal axis. Label it . Draw a vertical axis. Label it .
Along the horizontal axis use a scale of one square degrees. Along the vertical axis use a scale of one square . Plot the points in the table. Draw a smooth curve through the points.
Your graph should resemble:
Does this represent a periodic function? Explain.
The graph represents a periodic function because the -values show a pattern that repeats at regular intervals.
State the period of this function. (In other words, how many degrees are in one period and how long does the period last?)
The period is the horizontal length of one cycle and the wheel revolves once each minute. From the graph, you can see that the cycle begins at and ends at . Therefore, the period is (), which is during one minute.
State the amplitude of this function.
The amplitude is half the distance from the maximum value to the minimum value of the function.
The maximum value is . The minimum value is .
Therefore, the amplitude is 10.
Which range or ranges of degrees on the graph show when the two friends are going up on the Ferris wheel? Which range or ranges of degrees on the graph show when the two friends are going down? In other words, for what degree values do each of these situations occur?
There are three ranges of degrees on the graph that indicate the friends are going up on the Ferris wheel. These correspond to the -values on the graph where increases. This occurs for the following degree values: to , to , and to .
Similarly, the friends are coming down on the Ferris wheel for -values on the graph where decreases. Along the -axis, you can notice that this occurs for the following degree values: to and from to .
The sine function

Now that you know how to identify a periodic function, examine some special periodic functions called sinusoidal functions.
Sinusoidal functions are periodic functions with equations that can be represented in terms of sine or cosine. Sinusoidal functions are created by transformations of f(x) = sin x. In particular, you will now focus on graphing the sine function and identifying its key properties.
As you have previously learned, the set of all possible values of the independent variable (the -value) is called the domain. The resulting set of all possible values of the dependent variable (the -values) is called the range.
Investigating the graph of
Use your scientific calculator to complete the following tables (round your calculations to two decimal places):
| Suggested answers |
|
|---|---|
| 0° | 0.00 |
| 30° | 0.50 |
| 60° | 0.87 |
| 90° | 1.00 |
| 120° | 0.87 |
| 150° | 0.50 |
| 180° | 0.00 |
| 210° | -0.50 |
| 240° | -0.87 |
| 270° | -1.00 |
| 300° | -0.87 |
| 330° | -0.50 |
| 360° | 0.00 |
| Suggested answers |
|
|---|---|
| 390° | 0.50 |
| 420° | 0.87 |
| 450° | 1.00 |
| 480° | 0.87 |
| 510° | 0.50 |
| 540° | 0.00 |
| 570° | -0.50 |
| 600° | -0.87 |
| 630° | -1.00 |
| 660° | -0.87 |
| 690° | -0.50 |
| 720° | 0.00 |
Notebook
As you entered the values, did you start to see notice a pattern? If so, can you describe the pattern in a few words or a sentence in your notebook? Compare your responses to the suggestions provided.
The -values repeat themselves every .
What type of function does this represent?
This graph represents a periodic function.
Investigating the properties of the graph of

You may have found it tedious to determine all the values in the table one by one.
Graphing the points without technology is also difficult to do accurately because of the decimal values. In this section, you’ll graph using technology and then describe various features of the graph.
Try it!
Use the graphing app to graph by entering in the input bar.
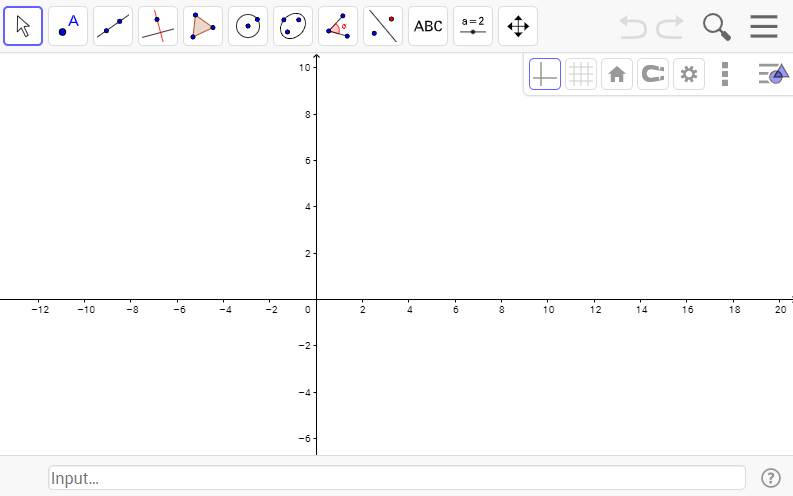
Your graph should be like the following:
Try it!
The equation is a function as you can identify from the above graph. How can you prove this graph represents a function?
The graph of satisfies the vertical line test (VLT). That is, no matter where a vertical line is drawn on the graph, it intersects the graph at only one point.
Therefore, the graph of is a function.
What is the period?
The completion of one cycle is the period. Therefore graph of completes one cycle in
This can also be noticed in the table of values: the -values repeat the same pattern from to as from to 720°.
State the maximum and minimum values of the function.
The maximum value of the function is . The minimum value is .
What is the amplitude?
The difference between the maximum and minimum value is . Half of is . The amplitude is . This can be easily identified on the graph because the -axis is the midway position and the highest and lowest points on the graph are one unit away from the -axis.
State the domain and range of .
The domain is the set of all real numbers (expressed in degrees). The domain may be recorded in set notation as follows: .
The range is the set of all real values of between and .
The range may be expressed in set notation as follows: .
What are the intercepts?
The graph has a -intercept at . There are many -intercepts. For one period, the -intercepts occur at , , or where is an integer.
| Summary: Key properties of | For one cycle of : |
|---|---|
| Period: | |
| Amplitude: | |
| Maximum value: | |
| Minimum value: | |
| Domain: | |
| Range: | |
| -intercept: | |
| -intercepts: , , |
Notebook
You can use your notebook to complete each of the following questions. Compare your work with the suggested answers to check your understanding.
Using your notebook, sketch the graph of for three cycles.
State all the -intercepts.
For three cycles of the graph, the -intercepts occur at , , , , , , and .
State all the maximum points. What is the maximum value?
The maximum points are , , and .
The maximum value is .
State all the minimum points. What is the minimum value?
The minimum points are , , and .
The minimum value is .
Clockwise and counter-clockwise
In the previous exercise, the is graphed for positive degree values. These positive values correspond to a counter-clockwise rotation of a point on a circle on the Cartesian plane, starting at the positive -axis and moving up toward the positive -axis.
In the Cartesian system, adding (or positive) degrees indicates counter-clockwise rotation while subtracting (or negative) degrees indicates clockwise rotation.
When point is rotated to point , it moves counter-clockwise.
When point is rotated to point , it moves clockwise.
A point on a circle can also be rotated in the clockwise direction by starting at the positive -axis and moving down toward the negative -axis. This direction of rotation corresponds to negative degree values such as , , , and so on. The graph you created using the graphing app showed the graph of for negative -values as well as positive -values. This should clarify how to interpret a negative degree value.

Transformations of the graph of .
In Unit 1, you graphed the basic quadratic function and then you applied transformations to graph the function .
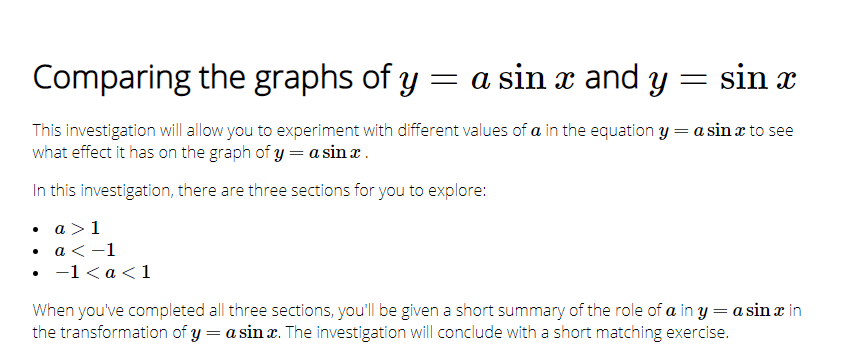
In a similar fashion, you will now investigate transformations of the basic function . In particular, you will determine the roles of , , and in the functions , , and .
Investigation 1: Comparing the graphs of and
You’ve already examined the graph of and its key properties.
Now, you’ll be given a chance to investigate transformations of the basic function .
Try it!
State the amplitude and the range of the graph of the sinusoidal function .
Since , the amplitude is and the range is .
State the amplitude and the range of the graph of the sinusoidal function .
Since , the amplitude is and the range is .
Which of the previous two functions represents only a vertical stretch of ?
The graph of represents only a vertical stretch of .
Which of the previous two functions represents a vertical stretch and a reflection in the -axis of ?
The graph of represents a vertical stretch and reflection in the -axis of .
Notebook
In your notebook, create a series of equations in the form that represents the description of the following two graphs. Compare your work with the suggested answers provided.
First, create an equation in the form that is reflected in the -axis and the maximum value is .
The maximum value is ; therefore, the amplitude is . Since the graph is reflected in the -axis, then and the equation is .
The graph of is compressed vertically by .
Since the graph of is vertically compressed by , then and so the equation is .
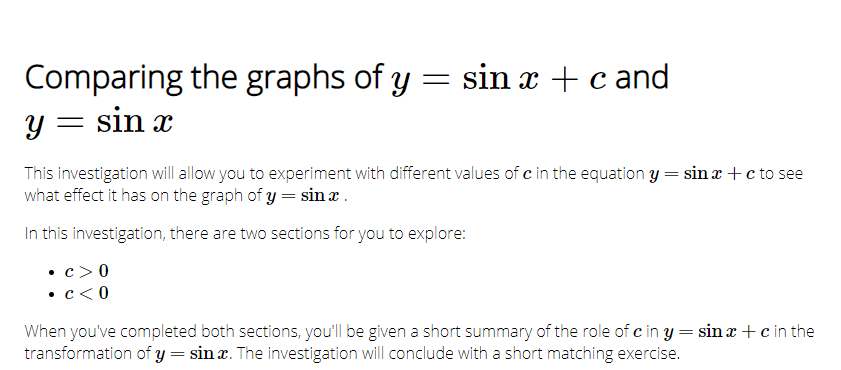
Investigation 2: Comparing the graphs of and
Now, you’ll be given a chance to compare the Graphs of and
Exercise 1:
Create an equation in the form that represents this information:
- The graph of is reflected in the -axis.
- The range of the graph is .
The range of the graph is used to find the amplitude and the vertical translation. Since the -values extend from to , the amplitude is:
Since the graph is reflected in the -axis, then . The graph of extends from to . Since this graph extends from to , you must translate the graph of up three units.
Therefore, and the equation is .
The graph of is not reflected. The maximum value of the graph is and the minimum value is .
The minimum and maximum values tell us the range of the graph. Use this information to find the amplitude and the vertical shift. The amplitude is
so .
The graph of extends from to , but since the maximum value of the given graph is , then it must be shifted down three units, so .
The equation is .
Exercise 2:
Create an equation in the form to represent the following graph.
A quick way to find the amplitude and vertical displacement is to find the horizontal line that cuts the graph in half. This represents the middle, or rest position, of the graph. It occurs at , which is drawn on the following graph.
Since the rest position is at , this means that the vertical shift is two units up, so .
The maximum value is three units above this horizontal line and the minimum value is three units below this horizontal line, so the amplitude of the graph is and since the graph is not reflected in the -axis, then . The equation of this graph is .
Create an equation in the form to represent the following graph.
The middle, or rest position, is the horizontal line , depicted in the following graph:
Since the rest position is at , the vertical shift is one unit up, so .
The maximum value is four units above this horizontal line, and the minimum value is four units below this horizontal line, so the amplitude of the graph is . Since the graph is reflected in the -axis, then , a negative number. The equation of this graph is .
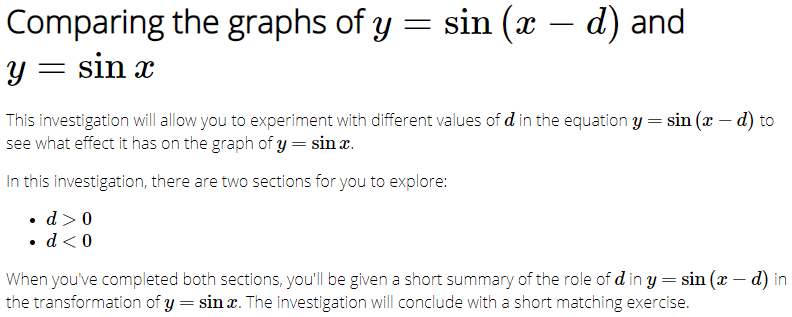
Investigation 3: Comparing the graphs of and
Now, you’ll be given a chance to compare graphs of and .
Exercise 1:
State the phase shift for each of the following:
Compare to and so . The phase shift is to the right.
Compare to and so since . The phase shift is to the left.
Exercise 2:
What transformations must be applied to the graph of to obtain the graph of each of the following?
Since and , the graph of is shifted left and down two units.
Since , , and , the graph of is flipped (reflected) in the -axis, shifted right and up four units.
For , state the domain for one cycle and state the range.
For , state the domain for one cycle and state the range.
Exercise 3:
Create an equation in the form that represents the given transformations of the graph of .
The graph of is shifted to the left and five units up.
The horizontal shift is to the left, so . The vertical shift is five units up, so . The equation of the transformed graph is .
Create another equation in the form that represents the given transformations of the graph of .
The graph of is reflected in the -axis and shifted to the right and two units down.
The graph is flipped (reflected) in the -axis, so . The horizontal shift is to the right, so . The vertical shift is two units down, so . The equation of the transformed graph is .

Review

While transforming a sinusoidal function, the following cases are possible:
- In the function , d represents vertical translation. If is positive, then the graph shifts up the y-axis by the amount . If is negative, then the graph shifts down the -axis by the amount .
- In the function , the value represents a horizontal translation. If is positive, then the graph shifts to the right by the amount . If is negative, then the graph shifts to the left by the amount .
- In the function , The value a represents the vertical stretch/compression, which changes the amplitude of the sine function. If a is negative, it also represents a reflection of the function in the -axis.
Self-check
As a self-directed learner, you will be reflecting on your learning process and checking your understanding in order plan for success. Make a note of your understanding of the success criteria from today’s activity.
Rate your understanding on a scale of five to one.
Five means “I have a thorough understanding.” One means “I am confused.”
Are you able to
Math journal

At the end of the course, you will fine-tune 8 entries (two from each unit) from your math journal and submit them as your “Culminating Assessment - Math journal” (Opens in new window).
Summarize transformations of periodic functions in your math journal with the findings from the investigations. It may resemble the following chart.
| Parameters in |
Transformation | Effect on: amplitude, domain, range, and period |
|---|---|---|
| or | ||
Once you feel comfortable with the success criteria, complete the following questions to assess your progress.
Assess your understanding: Periodic functions
Think
Let’s take some time to assess your understanding of the concepts behind periodic functions.
- Analyse the following graph.
Does it represent a periodic function? Justify your answer.
The graph represents a periodic function because it has a pattern that repeats at regular intervals.
Determine the period and amplitude if it is a periodic function.
From the graph, use as the beginning of one cycle and as the end. Subtract .
Therefore, the period is .
The maximum value is and the minimum value is .
Therefore, the amplitude is .
- Analyse the following graph.
Does it represent a periodic function? Justify your answer.
The graph does not represent a periodic function because it does not have a pattern that repeats at regular intervals.
Determine the period and amplitude if it is a periodic function.
The graph does not represent a periodic function and thus has neither a period nor amplitude.
- Analyse the following graph, if you dare.
Does it represent a periodic function? Justify your answer.
The graph represents a periodic function because it has a pattern that repeats at regular intervals.
Determine the period and amplitude if it is a periodic function.
From the graph, use as the beginning of one cycle and as the end. Subtract .
Therefore the period is units.
The maximum value is and the minimum value is .
Therefore, the amplitude is units.
Refer back to Exercise 1 in the periodic functions section of the activity. Suppose the diameter of the Ferris wheel is and the wheel continues to revolve once per minute.
Predict how the graph of this periodic function will be different than the one shown in Exercise 1.
Prediction: Since the diameter of the Ferris wheel is , the radius is and so the highest value on the graph will be and the lowest value will be . The amplitude will be .
- Complete the following table of values:
| Rotation of wheel (degrees) |
Suggested answers Height, relative to -axis (metres) |
|---|---|
In your notebook, graph the points in the table.
What is the resulting graph resemble?
Was your prediction accurate? Explain.
One of the student’s answer: “Yes. My prediction was correct. The highest value is and the lowest value is . The amplitude is .”
Determine the period for this new graph.
The period is during one minute.
In what situation would the period change for a Ferris wheel?
For a Ferris wheel, the period changes when the speed of the Ferris wheel changes. In other words, the period changes if the time for one revolution becomes less than or more than one minute.
Assess your understanding:
- A miniature Ferris wheel, with a diameter of , is constructed for an advertisement display. It rotates once each minute. The following diagram represents the Ferris wheel relative to the Cartesian plane.
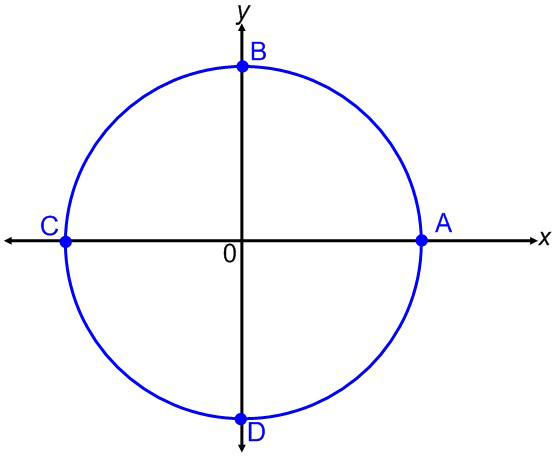
Determine the coordinates of the points , , , and on the diagram.
Since the diameter of the Ferris wheel is , then the radius is . Each point is on a radius of the circle. The coordinates of the points are shown on the following diagram:
Use the points you found earlier to complete the following table:
| Rotation of wheel (degrees) | Height, relative to -axis (metres) |
|---|---|
In your notebook, graph the points in the table. Draw a curve of best fit through the points.
Compare the graph you have drawn to the graph of . What do you notice?
The resulting graph is identical to the graph of . Since the Ferris wheel has a diameter of , its radius is and so the -values in the table produce the same pattern as those of the sine function.
State the period and the amplitude of the graph.
The period is in one minute and the amplitude is . These values are the same for the sine function.
Assess your understanding: Transformations
- State the amplitude and the range of the graph of .
- State the amplitude and the range of the graph of .
Which of the previous represents a vertical stretch and a reflection in the -axis of the graph of ?
Which of the previous represents a vertical compression of the graph of ?
Create an equation in the form that represents the following description:
The graph’s minimum -value is and the maximum value is .
The minimum value is , therefore the amplitude is and so .
The equation is .
Create an equation in the form that represents the following description:
The range of the graph is and the graph is reflected in the -axis.
Since the range is , the amplitude is .
Since the graph is reflected in the -axis, then and so the equation is .
Create an equation in the form for:
The graph of after it is translated down five units.
Since the graph is translated down five units, , so the equation is .
Create an equation in the form for:
The graph of after it is reflected in the -axis and shifted up six units.
Since the graph is reflected in the -axis, then . Since the graph is shifted up six units, then . The equation is .
- Create an equation in the form to represent the following graph.
Since the rest position is at , this means that the vertical shift is three units up, so . The maximum value is units above this horizontal line and the minimum value is units below this horizontal line, so the amplitude of the graph is and since the graph is not reflected in the -axis, then . The equation of this graph is .
State the phase shift for the function .
Compare to and so . The phase shift is to the right.
Given , what transformations must be applied to the graph of to obtain the graph of ?
Since and , the graph of is vertically stretched by and shifted right .
State the domain for one cycle.
The first -intercept will occur at , so the domain for one cycle is .
State the range.
Since the graph is vertically stretched by , the range is .
-
Create an equation in the form that represents the given transformations of the graph of .
The graph of is vertically stretched by , shifted to the left, and translated three units up.The vertical stretch factor is , so . The horizontal shift is to the left, so . The vertical translation is three units up, so . The equation of the transformed graph is .
The graph of is shifted right and up seven units.
The horizontal shift is to the right. The vertical shift is seven units up, so . The equation of the transformed graph is .